Welcome everyone to the final part of the Big 5 Natural Causes of Climate Change - here I examine the impacts of changing cloud cover.
On balance, clouds cool our climate
Conversely, fewer clouds will produce global warming, as well as extreme local heat waves.
As climate scientist Kevin Trenberth explained in 2009, “Global warming is mainly caused from increases in absorbed solar radiation due to decreasing cloud cover.”
Most climate scientists admit, the great difficulties in estimating cloud effects have caused significant uncertainty regards global warming calculations.

Because the amount of water vapor in the atmosphere rapidly declines with altitude, High clouds are usually thin and reflect a minimum of sunlight, but still have a greenhouse effect. Whereas low clouds are denser and will significantly reduce the solar radiation absorbed at the earth's surface
According to calculations in wild 2019, on average clouds reduce about 54 watts per meter squared of the sun's energy
One quick side note here: Non-scientists are often put-off by the unfamiliar measurement used by all climate scientists of watts per meter squared. But it is just a measure of energy flowing each second into and out of the earth. For our purposes, all one needs to understand is the greater the number of watts, the greater the energy flow.
To determine if humans are disrupting the earth's energy balance, scientists construct energy budgets as illustrated here. But the amount of information is so dense, it readily confuses the general public. To help clarify, I’ll guide you through the important points.
It is also important to pay attention to the plus or minus numbers that reflect how uncertain each calculation is.

For example, here they calculate that the earth's surface absorbs just 6 tenths of a watt more than it emits back to space with that imbalance causing the earth to warm. But being good scientists, Stephens (2012) also published that their calculations could be 17 watts too high or 17 watts too low, reflecting just how unsettled the science is. So, beware of the scientists' illustrations that do not accurately publish their uncertainty.
Some estimates are very accurate. Satellite measurements of solar radiation have very little uncertainty. After averaging for day and night, and differences between the equator and the poles, energy budgets begin with an average solar input of 340 watts per meter squared at the top of our atmosphere.
After subtracting estimates of the energy absorbed by the atmosphere and reflected by clouds or the earth's surface, they estimate each square meter of the earth's surface absorbs on average between 159 and 165 watts.
What confuses most people is why isn't the earth cooling if the surface absorbs about 160 watts of solar energy, but then releases more than twice that energy away as infrared?
The confusion arises due to the greenhouse effect. Primarily water vapor and clouds, plus carbon dioxide and other minor greenhouse gases readily absorb most infrared energy. But in less than a microsecond, greenhouse gases immediately lose that energy either via a collision with O2 and N2, or emit that energy, with half that energy being directed back towards the surface and recycled. The recycling of infrared energy is called greenhouse warming, but it would be more accurately called delayed cooling. The more energy that is recycled the slower the surface cools.
Click-bait mainstream media and politicians greatly mislead the public when suggesting CO2 traps heat energy. Each time heat energy is recycled back towards the surface, the earth quickly emits 10% to 30% of that energy as infrared energy in wavelengths that greenhouse gases cannot absorb. So, with every recycling of downward infrared energy, 10 to 30% leaks back to space uninhibited and it exits at nearly the speed of light.
Clouds increase the amount of greenhouse heat that gets recycled, and according to wild 2019, on average clouds re-direct 28 watts per meter squared back to the surface.
However, because clouds reflect away twice as much solar energy as they recycle, on balance, clouds cool the earth by 26 watts per meter squared.
Eventually it is estimated that 239.7 watts per squared, and an uncertain plus or minus 3.3 watts, escape to space. The claim that CO2 is causing a warming crisis by creating a heating energy imbalance of 0.6 watts per meter squared is questionable simply due a level of uncertainty that is 5 times greater than their claim
Furthermore, when compared to the IPCC’s estimated 2.5 watts of added greenhouse gas warming, reduced cloud cover can also amplify solar heating. A cloudless sky can have 10 times the heating effect of CO2.

The earth’s atmospheric circulation causes both moist regions with dense cooling clouds and hotter drier regions with clear skies. The primary driver of atmospheric circulation is the Hadley Circulation. The intertropical convergence zone or ITCZ is a region near the equator where the north and south trade winds converge, driving moist air upwards and generating towering cumulonimbus rain clouds.
Thus, the ITCZ covers a region of heavy precipitation which sustains the earth's equatorial rainforests.

What goes up must come down. After the moisture rains out, the air is dry and sinks to the north and south of the ITCZ. The sinking dry air prevents cloud formation, minimizes rainfall, and increases extreme solar heating, characteristic of the world's deserts.
When incoming solar energy is averaged across the globe, it obscures critical local dynamics caused by clouds. Whereas the global average of surface solar heating is about 160 watts per meter squared, at midday under clear tropical skies, the surface can receive 1000 watts. Under the clearer skies at the edge of the Sahara Desert, Aswan, Egypt constantly receives 160% of the averaged solar heating (or 263 watts per meter squared)

Cloudless desert skies also cause extreme weather swings. According to NASA, deserts experience the most extreme annual maximum temperatures, averaging 38 Celsius or over 100 degrees Fahrenheit. With fewer clouds, surface heat more rapidly cools at night as less infrared heat is recycled. And temperatures can drop by 75 degrees Fahrenheit falling below freezing.
In 1913, Death Valley reported the world's record high daily temperature of 56.7 Celsius or 134 Fahrenheit. Just 6 months earlier, similar dry cloud free conditions produced Death Valley’s coldest minimum temperature of minus 9 degrees Celsius or 15 Fahrenheit.
On smaller scales, heat domes form wherever descending air currents prevent convection and reduce cloud cover, causing extreme solar heating,

Jet stream troughs promote rising convection, more clouds, and cooler temperatures. Jet stream ridges cause dry descending air, less cloudy skies, and high temperatures
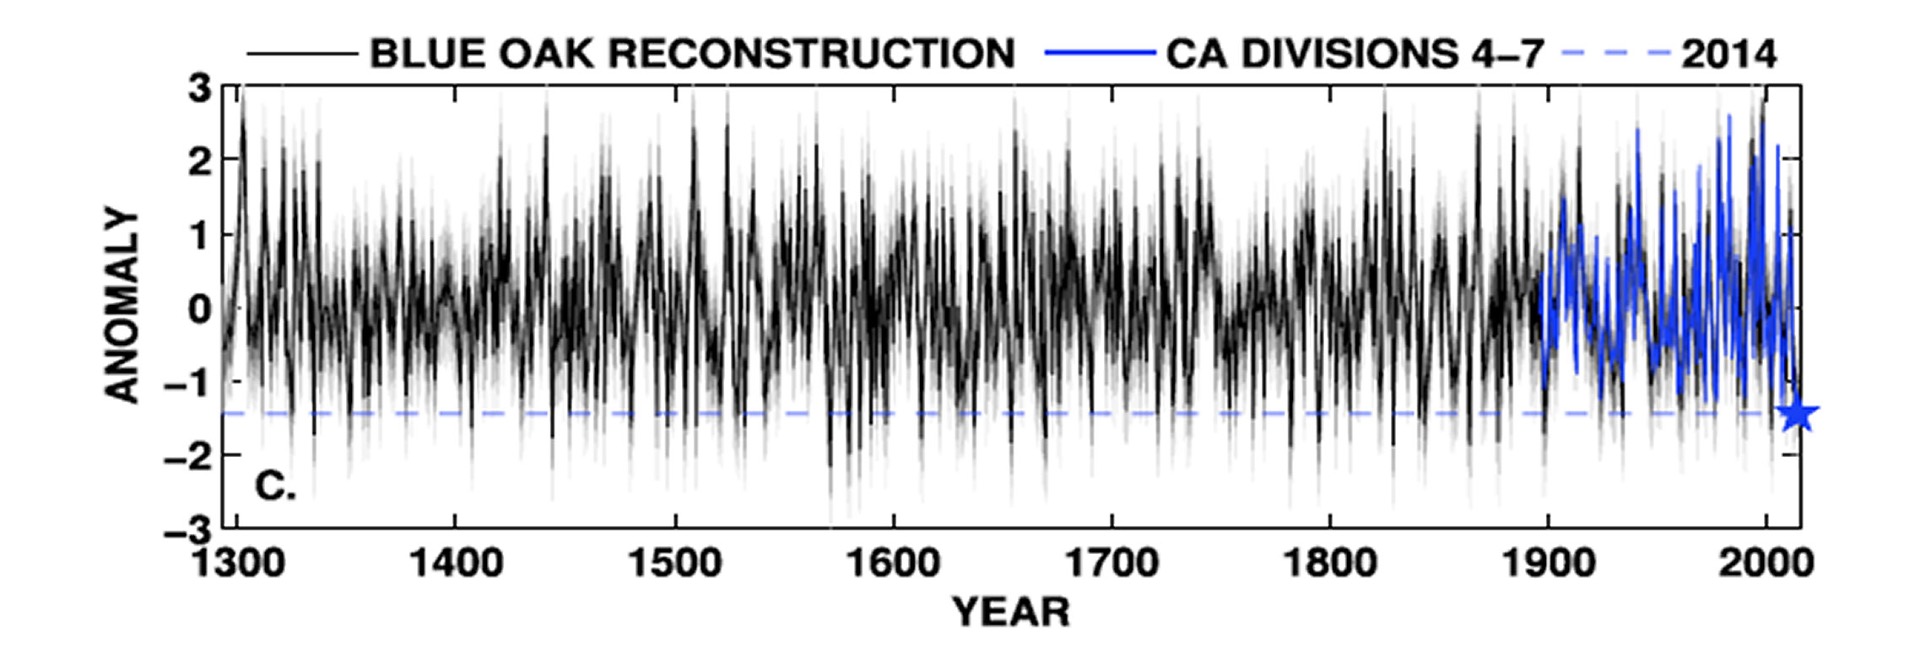
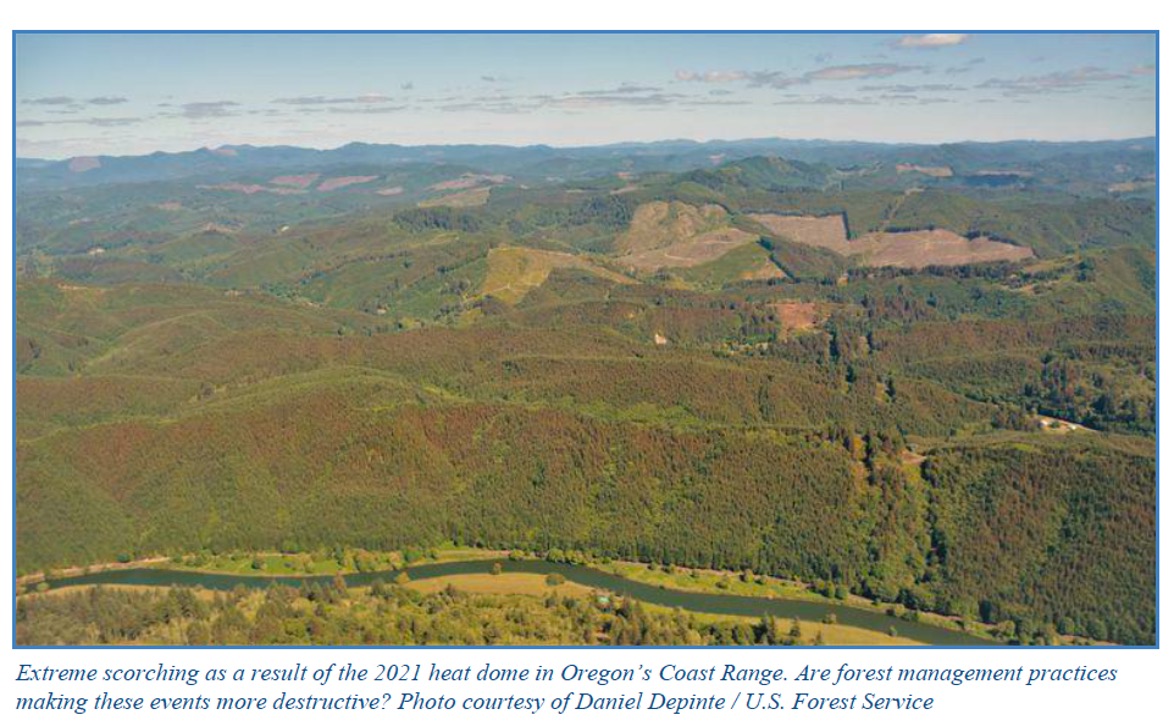
The cloudless skies beneath a stalled jet stream ridge caused the stifling heat dome over northwestern north America in 2021. As detailed in part 2, that heat dome generated Canada’s record high temperatures of 49.6 Celsius or 121.3 Fahrenheit.
On a global scale several studies have reported cloud cover has been decreasing since at least 1980, with the advent of satellite coverage. A 2014 study determined there was a 6.8% decrease in cloud cover over the northern hemisphere which increased solar heating by 5.4 watts. That declining cloud effect adds twice as much solar energy than what the IPCC attributes to rising greenhouse gases, and over 3 times the heating attributed to rising CO2.

A 2022 paper reported a similar decrease in cloud cover, noticing the rise in global temperatures correlated with decreasing cloud cover. Thus, researchers also argued cloud cover has a greater radiative effect on global warming than rising CO2.

However, different types of clouds have different causes and very different heating and cooling effects, so more detailed analyses beyond total cloud cover are needed to correctly assess the effects of changing cloud cover. Low level clouds below 2000 meters, significantly reduce solar heating and minimally add to any greenhouse warming.

Stratus clouds form in flat layers when moist air sits over cooler surfaces causing, water vapor to condense into liquid drops. Moist air traveling over regions of cold ocean upwelling produces low stratus clouds, also known as fog. Also, when a warm air mass gradually moves over a cold air mass stratus clouds form.
In contrast, the lumpier tops of cumulus clouds form when heated surfaces cause several currents of rising moist air that condense at higher altitudes.
If there is an abundant supply of moisture, such as over tropical oceans, the latent heat released from condensing moisture powers the rising momentum that grows a low-level cumulus cloud into a towering cumulonimbus that rises to the stratosphere. Because the stratosphere is warmer than the rising air, these cumulonimbus clouds flatten out at the stratosphere boundary causing the characteristic flat anvil top.
High altitude cirrus clouds are thinner and don't reflect much solar heat but do have a small greenhouse effect causing net warming. Cirrus clouds are often produced by the outflow from the anvil top of cumulonimbus clouds. Because cirrus clouds are composed of ice crystals and slow to evaporate, cirrus are often transported far from their point of origin.
Observing the narrowing of the ITCZ during the decades of recent warming and the resulting reduction of cirrus cloud production, MIT’s Dr. Lindzen postulated the "iris effect", a negative feedback mechanism promoting climate balance by reducing cirrus caused greenhouse warming.
Adding to the complexities of cloud science is the diversity of cloud life cycles, with most individual clouds growing and dissipating in less than one hour. Their varied lifetimes are being better determined by geo-stationary satellites. The Madden Julian Oscillation, first discovered in 1971, is a natural climate dynamic causing growing and dying clouds to move across the tropical ocean at speeds between 14 to 19 kilometers an hour, creating alternating regions of heavy rains and marine heat waves.

Heated waters of the Indian ocean warm pool initiate rising convection that gives birth to a cumulonimbus cloud. As the cloud grows, it reduces the amount of infrared heat that escapes to space. However, it also increasingly blocks solar heating, and on balance causes the ocean surface to cool which initiates the clouds decay.
After the moisture rained out of the rising air in the growing cloud, the remaining dry air descends further to the east suppressing convection The cloudless skies beneath the descending air causes intense solar heating of the ocean surface. According to Wirasatriya (2017) 60% of the equatorial hot events with sea surface temperatures exceeding 30 degrees Celsius for 6 to 30 days, are associated with this phase of the MJO Eventually surface heating initiates a new region of convection and new cumulus cloud formation
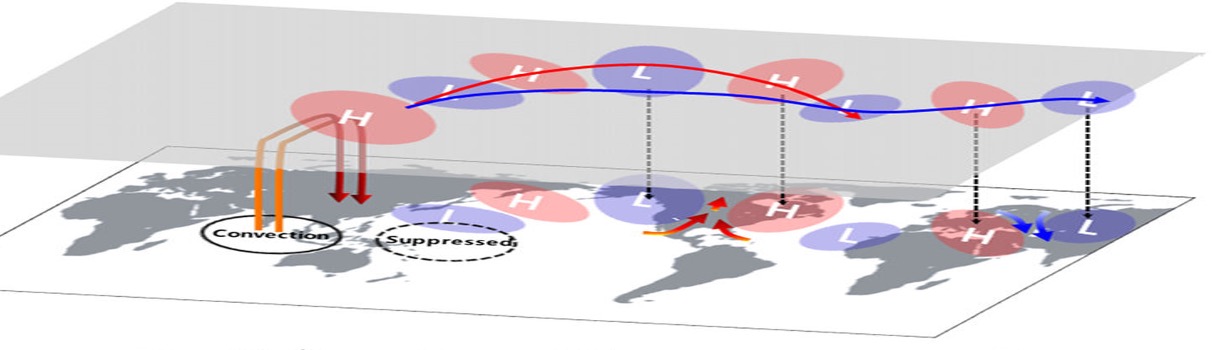
The intense convection of the Madden Julian oscillation also initiates other wave trains of rising and sinking air that stretches across the hemisphere. The wave train's high-pressure areas can create heatwaves as far away as the Atlantic.

The greatest amount of solar heat flux into the ocean happens along the equatorial Pacific, and that heat then gets transported across the globe and to warms the earth. The cloudless areas of intense solar heating during the Madden Julian Oscillation's hot events contribute to the increased heat flux into the western and central Pacific. But due to upwelling of colder waters in the eastern Pacific, the Madden Julian oscillation doesn’t reach that region.

As detailed in part 3 of this series, it is the clearer skies in the eastern Pacific associated with La Nina like ocean conditions that enables the greatest amount of heat flux into the eastern Pacific.
Not only do La Nina like conditions in the Pacific increase ocean heating, La Ninas and the related negative Pacific Decadal Oscillation, expand the Hadley circulation’s region of reduced clouds and increased solar heating

And same as the Madden Julian Oscillation, La Nina's center of intense convection in the western Pacific, initiates hemispheric wave trains and alternating regions of high and low pressure. The descending air under one high pressure region resulted in clear skies, increased solar heating and calm winds that reduce evaporative cooling, and produced a notorious long-lived heat wave in the north-eastern Pacific dubbed "The Blob"
Every 3 to 7 years an El Nino causes an eastward flow of warm water, that increases cloudiness and reduces heat flux into the eastern Pacific. The first extreme El Nino of the 21st century happened in 2015 and 2016
That El Nino shifted the center of intense convection eastward, which also produces different wave train pathways. Accordingly, the 2016 El Nino's new wave train ended the hot Blob's existence.


Coral reefs of Fiji, Tonga & Rarotonga have recorded 150 years of ocean warming and are sensitive to temperature changes caused by the Pacific Decadal Oscillation.
La Nina-like conditions during each negative Pacific Decadal Oscillation (PDO) phase reduce clouds in the eastern Pacific. Accordingly, during each negative Pacific Decadal Oscillation phase, ocean heat content has increased

El Nino-like conditions dominate during each positive PDO phase, generating a cloudier eastern Pacific & reduced ocean heating
Several studies have reported that the Hadley circulation is widening, Especially during La Ninas and negative Pacific Decadal Oscillations As the regions of descending air currents and reduced-cloud cover expand poleward, heat flux into the Pacific increases.
Both observational and modeling studies find That as the world warmed the Hadley circulation intensified and the ITCZ narrowed. As illustrated by Su (2017) the narrowing of the ITCZ causes the region of cumulonimbus clouds to narrow but extend further upwards (the darker blue cloud), while reducing the cirrus clouds that before had extended away from the anvil tops (the gray cloud outlines). That dynamic is similar to Lindzen's “Iris Effect” that would reduce cirrus greenhouse warming.

But there would also be a greater warming effect caused by the reduction in low level subtropical clouds that allows greater solar heating. As Shin 2012 and others have reported, the Hadley Circulation's intensification widens the regions of descending air currents, reducing cloud cover and expanding the dry lands as illustrated by the change from larger low level clouds areas before (colored gray) evolving into smaller low level cloud cover (illustrated in darker blue).
The regions with the greatest reduction in global cloud cover occur where heat flux into the oceans is greatest.
So, to whatever degree the cause of global warming, whether the Big 5 Natural Causes or added CO2, the resulting reduction in low level tropical cloud cover would serve as positive feedback amplifying any warming.
The Big 5 Natural Causes of climate change together, do explain most of the 150 years of global warming.

When the causes of natural climate change are fully accounted for, as good rigorous science traditionally demands, it constrains to what degree warming effects can be attributed to rising CO2.. Constrained by natural climate change, CO2 can only contribute much smaller amounts of heat than what's repeated by the narratives of alarmists seeking to control energy policies. Clearly when you follow all the science, there is no climate crisis
Up next: Well, I’m taking a 2-week vacation will determine the topic of my next video when I return. But I encourage you to send me suggestions for topics that you feel are needed to further clarify climate science
Until then, heed renowned scientist Thomas Huxley’s advice, skepticism is the highest of duties and blind faith the one unpardonable sin.
And if you appreciate the science clearly presented here, and rarely presented in mainstream media then please, give it a like, give it a share or copy the URL and email it to friends, subscribe to my channel to find all my videos or read my book Landscapes and Cycles: an Environmentalist's Journey to Climate Skepticism.
Thank you