Translate

Wednesday, February 13, 2019

Changing Sea Levels: Sinking Lands vs Rising Sea

(web version of column article published in Pacifica Tribune February 13, 2019 )


What’s Natural? 

Changing Sea Levels - Part 1

Flooded Sinking Land in New Orleans after Hurricane Katrina


Local sea levels appear to rise when ocean volumes increase, but also when the land sinks. Scientists increasingly warn that coastal cities are sinking much faster than ocean volumes are rising. Pumping out groundwater not only causes lands to sink, it increases the oceans’ volume. China’s Huanghe Delta is sinking 10 inches a year. Southeast Asian cities battle sinking rates of 1.2 to 2.4 inches per year. Regions around Houston, Texas had sunk 10 feet by 1979; a disaster waiting to happen where hurricanes commonly generate 15-foot storm surges. Likewise, New Orleans was doomed by sinking 1.4 inches per year. Built on marshland, San Francisco’s airport sinks 0.4 inches per year.

In contrast, ocean warming plus added glacial meltwater are estimated to have only added 0.06 inches per year to sea level from 1850 to 1990, punctuated by decades that accelerated sea level rise to 0.14 inches a year. Still, that fastest rate of modern sea level rise remains only one-tenth of New Orleans’ sinking rate. 

Better water management could minimize the primary causes of sinking coastlines. But even if climate policies could reduce our carbon footprint, natural sea level rise that began in the 1800s will likely continue. To what degree rising CO2concentrations are accelerating sea level rise is still debated. Prominent climate scientist Dr. Michael Mann gives scant attention to the critical issue of sinking lands. He prefers scary models supporting his theory regards a rising CO2effect on sea level, “We’re talking about literally giving up on our coastal cities of the world and moving inland.”  Likewise, at California’s local coastal planning meetings, Mann’s followers similarly advocate moving inland, otherwise known as “managed retreat”. 

Intriguingly, San Francisco and North America’s west coasts have not experienced a rising sea level trend since the 1980s. Equally curious, using the average estimates from all researchers the 2007 Intergovernmental Panel on Climate Change (IPCC) reported known contributing factors only explained 40% of 20thcentury sea level rise. So, there is still much to learn.

San Francisco Sea Level (data from NOAA)


So, does Mann’s disaster scenarios represent an extreme climate doomsday cult? Or is he offering sage scientific advice we should heed?

Some researchers and politicians argue any accelerating rate of sea level rise must be the fingerprint of a human contribution as some models predict. But that is simply not true. In a 2007 peer-reviewed paper, On the Decadal Rates of Sea Level Change During the Twentieth Century, researchers reported rates of sea level rise accelerated up to 0.2 inches/year every 10 years, followed by a decade of deceleration. Sometimes sea levels fell.  Some of Mann’s followers believe it’s impossible for sea levels to fall in an age of climate warming. But they are ill-informed. 

20th Century changing rates of global sea level rise


Sea level remains un-changed when the same amount of water evaporating from the ocean returns to the ocean. However, when more rainfall remains on the land, sea levels fall. During the last Ice Age, rainfall stored in ever-growing glaciers caused global sea level to fall by 400 feet. Although those melting glaciers then raised sea level back to its current level, sea levels have yet to fully recover. Large amounts of meltwater that sank into the ground are still flowing slowly but surely back to the oceans.

Furthermore, water need not be stored as ice. When rains fall over land-locked landscapes with no outlets to the ocean, that precipitation similarly returns to the ocean via slow-moving sub-surface flows or evaporation. Rainfall over Nevada that sinks into the ground requires thousands of years to reach the Pacific. A similar fate befalls snowmelt and rainwater entering Lake Tahoe, and melt-water from Sierran glaciers draining into land-locked Nevada. Analyses of global sea level change have yet to fully incorporate the fact that over 13% of the earth’s land surface consists of landlocked basins slowly supplying ancient groundwater to today’s oceans.

Since the 1990s, satellites likewise detected a 10-year cycle of accelerating and decelerating sea level rise. A period of more El Niños followed by more La Niñas likely explains the 10-year accelerated rise followed by a 10-year deceleration. During the most recent deceleration, from 2010 to 2011 a La Niña amplified monsoons carrying above average rainfall into Australia’s landlocked basins. This caused global sea level to fall by nearly 0.3 inches. Amazingly, global sea level fell despite Greenland simultaneously experiencing its greatest ice melt. Conversely, during earlier El Niños, above average rains fell back onto the ocean, accelerating sea level rise. 

There is still no consensus regards Greenland and Antarctic contributions to sea level. There is also significant debate regards what adjustments need to be applied to satellite data. However, that discussion must wait for part 2. Until then, I urge local planning commissions to wait at least 20 more years for more data before “giving up on our coastal cities of the world and moving inland”.


Jim Steele authored Landscapes and Cycles: An Environmentalist’s Journey to Climate Skepticism

Contact: naturalclimatechange@earthlink.net 

Wednesday, January 30, 2019

Climate Fish Tales

from the column What’s Natural? published in the Pacifica Tribune and 5 other SF Bay Area papers January 30, 2019


American folk lore is filled with stories of how Native Americans observed changes in wildlife and foretold future weather changes. I was fascinated by an 1800s story of Native Americans inhabiting regions around Marysville, California who had moved down into the river valleys during drought years. They then moved to higher ground before devastating floods occurred. Did they understand California’s natural climate cycles? Could changes in salmon migrations alert them? 

Observing salmon has certainly improved modern climate science. In the 1990s climate scientists struggled to understand why surface temperatures in the northwest sector of the Pacific Ocean had suddenly become cooler while temperatures in the eastern tropical Pacific suddenly warmed.  Climate models predicted no such thing. However, fishery biologists noted salmon abundance in Alaska underwent boom and bust cycles lasting 20 to 40 years. When Alaskan salmon populations boomed, their populations from California to Washington busted. Conversely, decades later when Alaskan populations busted, those more southerly populations boomed.

Scientists soon realized the observed alternating patterns in fish abundance not only coincided with those puzzling changes in ocean surface temperatures, but also with regional drought-flood cycles, glacier growth and retreat, and tree-line advances and retreats. Tree rings and lake sediments also recorded cycles of 5 major Sierra Nevada droughts alternating with wetter decades during the past 300 years. This all convinced scientists of the existence of a natural “ocean oscillation” driving climate change. This climate see-saw was finally named the Pacific Decadal Oscillation (PDO) in 1997. (Science uses the term “oscillation” to describe repeating cycles with general, but imprecise time periods.)

The newly characterized PDO had yet to be included in climate models. But progress in climate researchrecently argues the PDO largely explains western North America’s last 100 years of climate change. So how do we separate naturally caused weather extremes from human contributions? Unfortunately, few Americans are aware of these “cycles”. But if we don’t educate our children about natural climate change, the next generation will surely fall victim to every Chicken Little climate story told by scientifically illiterate politicians or by journalists who profit from sensationalism; if it bleeds, it leads!

Similar fish tales have been reported globally. In the Atlantic, a similar oscillation was officially recognized in 2000. But according to fishery records, that oscillation has been noted since the 15thcentury. Norwegian fisheries documented 30 to 60-year boom and bust cycles for herring, sardines and anchovies. In the 1930s Greenland experienced a warming rivaling today’s temperatures. Simultaneously Danish Arctic ice records showed extensive sea ice melt. This all coincided with intrusions of warm Atlantic waters that brought Atlantic cod and herring northwards. Fish retreated decades later coinciding with cooling temperatures and recovering sea ice. Today’s Arctic warming and reduced sea ice has likewise coincided with greater intrusions of warm Atlantic water. Will there be a return cycle of retreating Atlantic waters that causes sea ice to rebound again?

Finally, contrary to recent claims of “unprecedented” rapid warming, Greenland’s air temperatures warmed more rapidly during the 1920s to 30s causing melting around Greenland’s ice cap. After warm waters retreated, Greenland gained ice from the 1960s to the 90s. A new period of rapid melting began in the 90s but peaked in 2012. Since then, Greenland’s melting gradually subsided and Greenland gained ice in 2017 and 2018, perhaps signaling a new cooling phase. 

And there is a truly optimistic fish tale. Monterrey Bay Aquarium Research Institute’s senior scientist Dr. Francisco Chavez is a Peruvian oceanographer who studies the PDO and upwelling effects on marine life. The upwelling region off the coast of Peru is known as the most productive fishery in the world because robust upwelling brings nutrients from dark ocean depths up to the sunlit layers increasing photosynthesis. During the cold Little Ice Age - 1300 to 1850 AD - marine life off Peru’s coast was at a low point. Starting in the late 1800s as temperatures warmed, plankton rapidly increased, which promoted rapid increases in fish abundance. This dramatic improvement in marine life is well documented in preserved sediments.

To promote plant growth, commercial greenhouses add an additional 1000 ppm to the current 400 ppm of atmospheric COconcentrations. So, did marine life also increase due to rising levels of CO2? Or perhaps, because land temperatures warm faster than ocean temperatures, did stronger winds increase ocean upwelling? Whatever the drivers of the observed increases in ocean life, it appears likely that rising COcontributed definitive benefits. 

If we are to truly understand climate change and discern human contributions, these fish tales all suggest we must first account for natural oscillations that have surely been operating for millennia. So, to rephrase Mark Twain, ‘reports of the earth’s imminent death within 18 years, via rising CO2, are likely greatly exaggerated’.


Jim Steele authored Landscapes and Cycles: An Environmentalist’s Journey to Climate Skepticism


Wednesday, January 16, 2019

Disentangling California Droughts

Devastating droughts are a great concern. Droughts disrupt ecosystems, agriculture, and drinking water supplies. Contrary to headlines suggesting we have only 12 years before descending into climate hell with more severe droughts, historically, Californians are not experiencing more severe droughts. Despite low stream flows and withering plants, there’s no agreement on how to best define drought. Different methods suggest different severities for the same drought. Thus, the Intergovernmental Panel on Climate Change’s recent assessment, downgraded their ability to detect the causes of drought to “low confidence”.


Ocean circulation determines how much rain reaches the land. Each summer, California naturally experiences months of drought because storms carrying ocean moisture are blocked. Every few years, a rainy El Niño year alternates with drought producing La Niñas. But 20 years of more frequent La Niñas can cause 20 years of drought. To address natural precipitation shifts, California constructed ~1400 dams, storing water during wet years that can be released during drought years. Yosemite’s Hetch Hetchy reservoir supplies about 25% of San Francisco’s drinking water and 17% of its electricity. Misguided attempts to remove its dam would be disastrous for humans with scant environmental benefits.


NOAA scientists analyzed California’s 2011-2014 drought concluding it was dominated by a La Niña and natural variability. In contrast, their models suggested any greenhouse contribution was “very small”. Similarly, drought-sensitive tree rings suggested the extremely low precipitation was not unprecedented nor “outside the range of natural variability”. For 1200 years, extremely low rainfall happens a few times every century. 

However, because higher temperatures can theoretically increase evaporation and dry the land, some researchers define drought by calculating the Palmer Drought Severity Index (PDSI). Despite using the same tree rings, the PDSI transformed a natural California drought into the worst in 1200 years, evoking global warming fears. 

What to trust? 

Most scientists agree the PDSI is biased towards worse droughts, because it assumes higher temperatures always dry the land. However, the opposite is also true! Without moisture to absorb heat, drier conditions produce higher temperatures.  Studies using more accurate measurements than the PDSI find no increase in global droughts. 

Before significant COwarming was possible, Dust Bowl years from 1928-1939 and the 1950s drought were the most severe 20thcentury American droughts. La Niña-like ocean temperatures blocked rain storms and triggered the Dust Bowl while plowing up native grasses made it worse. More concerning is 2 century-long megadroughts between 900 AD and 1400 AD. Trying to survive increasing dryness Native Americans created dams and irrigation canals. But those droughts finally led to the demise of once thriving Pueblo Cultures such as Mesa Verde.  

Will our modern water infrastructure protect us if drought history repeats? 

Reducing our carbon foot print or whacky plans to shade the earth from the sun to lower global temperatures will have no effect. Lower temperatures may in fact increase major droughts. Droughts during the 1750s, 1820s, and 1850s-1860s were similar to the 1950s. During the cool 1500s, the southwestern United States and Mexico suffered decades long droughts of “epic proportions”.

Coincident with the Pueblo Culture’s demise, drought is detected in sediments of San Francisco Bay. Droughts reduce stream flows that normally flush the bay, allowing salty ocean water to encroach deeper into the Bay’s delta. Past droughts caused the Bay’s Suisun Marsh to become 40% saltier. Suisun Marsh is now considered the only sustainable habitat for a critically endangered fish, the Delta Smelt. The current theory for the Delta Smelt’s demise is agricultural diversions of freshwater raised salinity to intolerable levels. That perceived competition for freshwater has pitted farmers against efforts to save the smelt.  Learning how the smelt survived a thousand years of much higher salinity might provide a win-win solution. 

Agricultural and urban needs also compete with salmon survival. One promising win-win solution is having juvenile salmon develop in irrigated rice fields after hatching. Experiments show young salmon grow much bigger in rice fields. Additionally, low stream flows hamper salmon migration. But when enough water is naturally stored as groundwater, seasonal groundwater release can maintain adequate summer stream flows.  Unfortunately, landscape changes have caused stream channels to cut downwards, draining local groundwater and drying the land. Restoring streams and groundwater would provide great benefits.

During my research in the Sierra Nevada, a meadow we were monitoring began to dry; willows died, and bird populations crashed. Many suggested it was just what global warming models predict. However, we determined a railroad track built over 100 years ago had caused the meadow’s stream channel to cut downwards, draining its groundwater. I initiated a watershed restoration. Vegetation quickly recovered, and wildlife increased. Despite California’s years of extreme drought, the restored meadow remained wetter than it had before restoration and before the drought. 

So, I warn: knee-jerk reactions simply blaming climate change for devastating dryness, blind us to real causes and real environmental solutions.

Thursday, January 3, 2019

A Look at the Camp Wildfire in Paradise


In early December I surveyed the horrific Camp Fire disaster in Paradise. Having been director for 25 years of a university field station located in the heart of the Tahoe National Forest, I’ve been a “student” of fire ecology for 30 years and wanted a closer look at why row after row of homes completely incinerated while surrounding trees were merely scorched, with leaves and needles browned but not burnt? 


Torched Homes in Camp Fire with Spared Trees


Large fires have recently ravaged about 1.8 million California acres a year, prompting media and politicians to proclaim a “new normal” that’s “evidence of global warming”.  But UC Berkeley fire ecologists have calculated that before 1800, fires burned 4 million California acres each year (despite cooler temperatures). So what natural fire dynamics promote such extensive burning?

Wildfires have indeed increased since 1970, but that’s relative to previous decades of intensive fire prevention. As fire was recognized as a natural and necessary phenomenon for healthy ecosystems a new era began. In the 70s the US Forest Service moved away from extinguishing all fires by 10 AM the day after detection, switching to a “let it burn policy” if human structures were not endangered.

Paradise, unfortunately, sprung up amidst a forest dominated by Ponderosa pines. Largely due to frequent lightning strikes and dry summers, Ponderosa habitat endures fires about every 11 years. Fortunately for California’s coastal residents, lightning is rare. However, both regions are vulnerable to human ignitions, which start 85-95% of all fires. Recognizing this growing problem, a bipartisan bill was presented to Governor Brown two years ago to secure our power grid. Shockingly he vetoed it. That was a bad choice given the Camp Fire, Wine Country Fires and many more were sparked by an ageing electrical infrastructure. Recent studies show larger fires result from a confluence of human ignitions and high winds. But it is not just random coincidence. The high winds that spread these massive fires also blow down power lines that ignite those fires.

In 2008 the world’s foremost expert on fire history, Stephen Pyne lamented, “global warming has furnished political cover to encourage certain fire management decisions while allowing climate to take the blame.” How true. Both PGE and Governor Brown have blamed wildfires on climate change. 

When you build a camp fire, you intuitively understand fire ecology basics. You do not hold a match to a log no matter how dry. You start a camp fire with kindling. Fire ecologists call forest kindling, like dead grass, leaves and small shrubs, “fine fuels”. In dry weather “fine fuels” become highly combustible in a matter of hours, or at most days, even during the winter. Furthermore, California’s summer climate is naturally dry for 3-4 months, creating highly combustible habitat each and every summer.

Additionally, camp fires only smolder without enough air, so we huff and puff to get a burst of flames. Likewise, high winds turn a spark into a major conflagration. It was strong winds that rapidly spread the Camp Fire. The fast-moving flames, feeding on “fine fuels” littering the forest floor, generated enough heat to ignite flammable homes that then burned from the inside out; but only enough heat to char the bark of most surrounding trees.

Miraculously spared buildings dotting a devastated landscape made the case for creating “defensible spaces” by managing the “fine fuels”. Surveying one unscathed church, the fire clearly came within 100 feet, scorching the base of every encircling tree. But due to a parking lot and a well-manicured lawn, the lack of “fine fuels” stopped the fire in its tracks. Trees on the lawn were not even charred. The public would benefit greatly if wildfire news stories emphasized the need to create adequate defensible spaces. 

With high deserts to the east and the ocean to the west, California’s winds shift with the seasons. Land temperatures always change faster than the ocean’s. In the summer, warmer land surfaces draw in moist sea breezes. The resulting fog moistens coastal landscapes and reduces fire danger there. Thus, any warming, whether natural or CO2driven, should increase the fog.

In the autumn, the land cools faster than the ocean causing the winds to reverse direction. The colder it gets, the stronger the winds blow from the high deserts towards the coast, peaking in December. These winds are called Santa Annas in southern California. The Wine Country fires were spread by the Diablo winds. But regardless of the name, the science is the same.  Accordingly, it was November winds that fanned a spark into an inferno aimed directly at the heart of Paradise. 

It has long been known that due to these autumn and winter winds, much of California endures a dangerous fire season year-round.  On the optimistic side, any warming of the land during the cool seasons, whether natural or COdriven, should reduce these winds. Indeed, the natural drivers of wildfire are very complex, and maintaining a defensible space is our safest bet.


Tuesday, June 12, 2018

Dr Judith Curry and Dr. Patrick Moore demolish Michael Mann in climate debate!

Here is the Transcript from Dr Judith Curry's statement from her debate along with Dr. Patrick Moore versus Michael Mann and Admiral Titley .   Well worth the read


reblogged from Dr. Curry's website https://judithcurry.com/2018/06/12/the-debate-mann-titley-moore-curry/


1    Cover

Good evening everyone.  Thank you very much for coming, I look forward to our conversation this evening.

2   Agreement/disagreement
There is widespread agreement on these basic tenets:
  • Surface temperatures have increased since 1880
  • Humans are adding carbon dioxide to the atmosphere
  • Carbon dioxide and other greenhouse gases have a warming effect on the planet
However, there is substantial disagreement about the issues of greatest consequence:
  • Whether the recent warming has been dominated by human causes
  • How much the planet will warm in the 21stcentury
  • Whether warming is ‘dangerous’
  • How we should respond to the warming
I have bolded the two issues that are the focus of this conversation.
Now there is nothing wrong or bad about scientific disagreement.  In fact, the scientific process thrives in the face of disagreement, which motivates research in new directions.

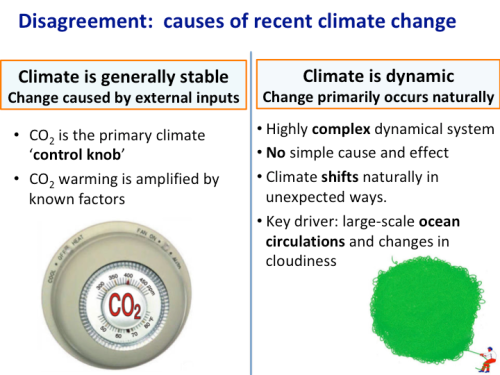
3   Disagreement: causes of climate change
On the left hand side is the perspective of a stable climate that changes in response to changes in atmospheric CO2.  In other words, carbon dioxide as the climate control knob.  It’s a simple and seductive idea.
However some scientists think that this is a misleading oversimplification.  They regard climate as a complex nonlinear dynamical system, with no simple cause and effect.  Climate can shift naturally in unexpected ways, owing to natural internal variability associated with large-scale ocean circulations.

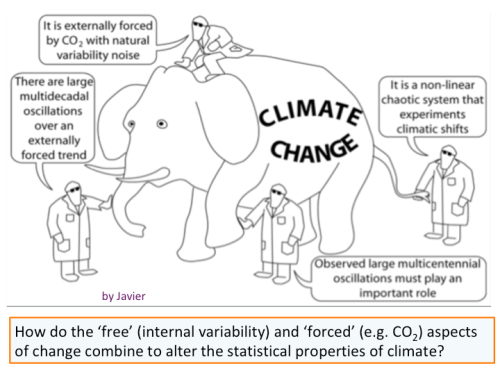
4    Elephant
Now these two perspectives are not mutually exclusive. Proponents of the CO2as control knob idea acknowledge the existence natural variability but dismiss it as noise that averages out.  Proponents of the natural variability arguments acknowledge the impact of CO2, but consider it to be a modest wedge that projects onto the natural modes of climate variability.
The point of this cartoon is that if you only look at one part of the elephant, you will misdiagnose.  You need to look at the entire elephant.
The bottom line is that we don’t yet have a unified theory of climate variability and change that integrates all this.

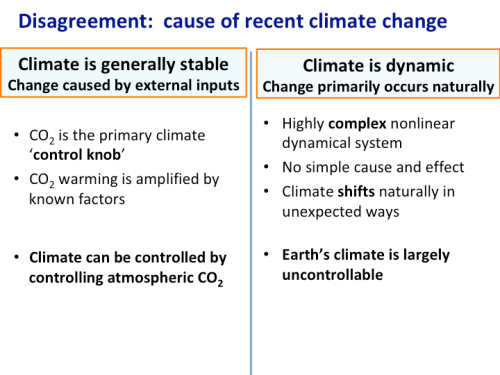
5    Disagreement: cause of climate change
So does this rather arcane scientific debate actually matter?  Well, yes it does.
If you assume that carbon dioxide is the control knob for climate, than you can control climate by reducing CO2emissions.
If you assume that climate change primarily occurs naturally, then the Earth’s climate is largely uncontrollable, and reducing CO2emissions will do little or nothing to change the climate.
My personal assessment aligns with the right-hand side, emphasizing natural variability.  However, the IPCC and the so-called consensus aligns with the left hand side.  About 10 years ago, I also aligned with left hand side, because I thought supporting the IPCC consensus was the responsible thing to do.
Here is how and why I changed my mind.

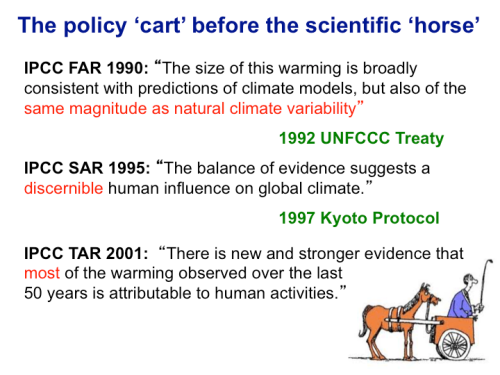
6    Policy cart before scientific horse
In 2010, I started digging deeper, both into the science itself and the politics that were shaping the science.  I came to realize that the policy cart was way out in front of the scientific horse.
The 1992 UN Climate Change treaty was signed by 190 countries before the balance of scientific evidence suggested even a discernible human influence on global climate.  The 1997 Kyoto Protocol was implemented before we had any confidence that most of the warming was caused by humans.  There was tremendous political pressure on the IPCC scientists to present findings that would support these treaties, which resulted in a manufactured consensus.

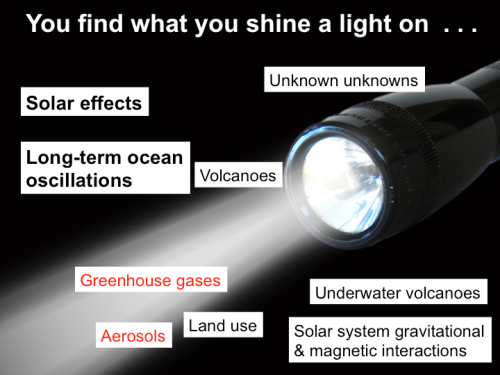
7     You find what you shine a light on
Here is how the so-called consensus and increasing confidence in human-caused global warming became a self-fulfilling prophesy.
You find what you shine a light on.  In other words, we have only been looking at one part of the elephant.
Motivated by the UN Climate treaty and the IPCC and government funding, climate scientists have focused primarily on human-caused climate change.  Other factors important for understanding climate variability and change have been relatively neglected. I have highlighted long-term ocean oscillations and solar indirect effects, since I think that these are potentially very important on decadal to century timescales.

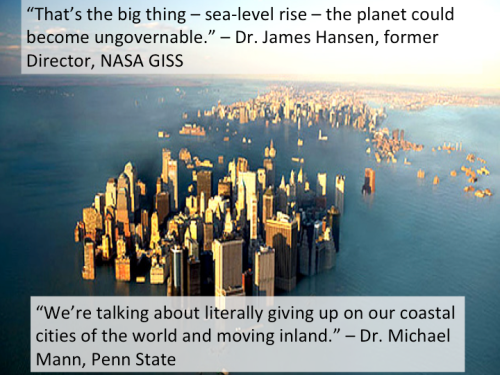
8     The sea level rise alarm
One of the most consequential impacts of a warming climate is sea level rise. These two statements by climate scientists typify the alarm over sea level rise:
Is this alarm justified by the scientific evidence?

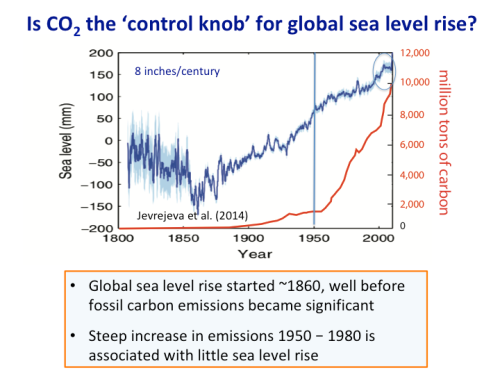
9 Is CO2 the control knob for global sea level rise?
This figure illustrates the challenge of attributing long-term sea level rise to CO2emissions. The blue curve shows sea level change since 1800, measured from tide gauges.
The red curve shows global emissions of carbon dioxide from burning of fossil fuels. You can see that global sea levels were rising steadily long before fossil fuels emissions became substantial. You can also see that the steep increase in emissions following 1950 is associated with very little sea level rise between 1950 and 1990.
An uptick in sea level rise occurred in the 1990’s, which is circled.  Lets take a closer look to see what is causing this.

10   What is causing recent sea level rise?
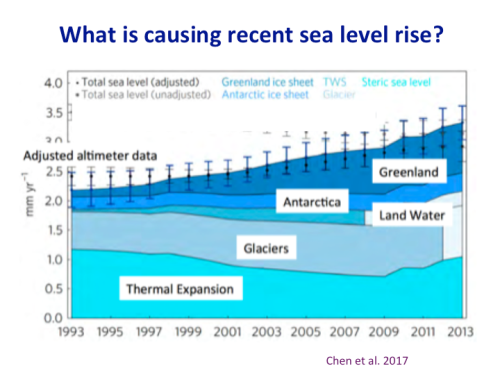
Since 1993, global satellite data have provided valuable information about sea level variations and glacier mass balance.  This figure shows a recent analysis of the budget of sea level rise since 1993.  You can see that overall the rate of sea level rise has increased since 1993.
What is causing this increase?  The turquoise region on the bottom of the diagram relates directly to expansion from warming.  You actually see a decrease until about 2009, which has been attributed to the cooling impact following the eruption of Mount Pinatubo in 1992.
What stands out as causing the increase in the rate of sea level rise is the growing contribution from Greenland, which is the dark blue area on top.  Hence the recent increase in the rate of sea level rise is caused by Greenland melting.

11  Variations in Greenland glacier mass balance
So, is the Greenland melting caused by increasing CO2 emissions?
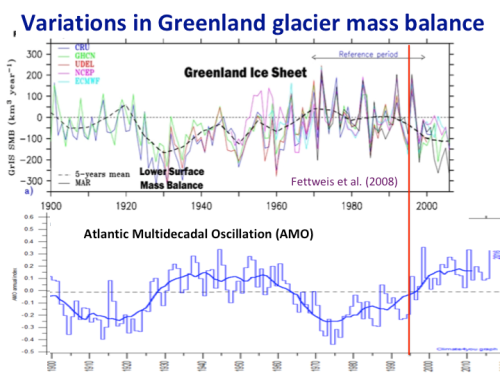
This figure shows the Greenland mass balance for the 20th century. Ice sheet mass balance is defined as increase from snowfall, minus the decrease from melting.  You can see the negative mass balance values after 1995, reflecting mass loss that raises sea level.  If you look earlier in the record, you see even larger negative values particularly in the 1920’s and 1930’s.  Clearly, the high surface mass loss rates of recent years are not unprecedented, even in the 20thcentury.
Greenland was anomalously warm in the 1930’s and 1940’s. What caused this?
The bottom figure shows variations in the Atlantic Multidecadal Oscillation, which is an important mode of natural internal climate variability.  The AMO is a powerful control on the climate of Greenland.
Ingeneral, years with positive AMO index are associated with a mass loss for Greenland, whereas negative AMO index is associated with a mass gain.

12  IPCC AR5 quotes on sea level rise
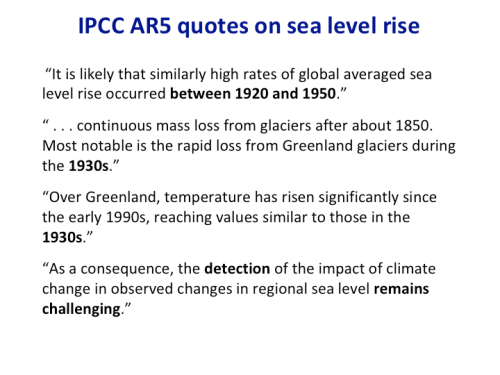
From this analysis, I can only conclude that CO2 emissions are not the main cause of sea level rise since the mid 19thcentury.
The scientific evidence that I’ve shown you on the preceding slides is well known to the IPCC.  Here are some statements that the most recent IPCC report made on sea level change and Greenland: 
13 To what extent are man-made CO2 emissions contributing to climate change?
I’ve been asked to respond to the question “To what extent are man-made CO2 emissions contributing to climate change?”
The short answer is:  ‘we don’t know.’ The reason is that we don’t know how to disentangle natural internal variability from the effects of CO2–driven warming
Even the IPCC doesn’t claim to know exactly. The most recent IPCC assessment report says it is ‘extremely likely’ to be  ‘more than half.’ ‘More than half’ is not very precise.
Given the IPCC’s neglect of multi-decadal and longer time scales of natural internal variability, I regard the extreme confidence of their conclusion to be unjustified
So here is my personal assessment, using the jargon of the IPCC:  Man-made CO2emissions are as likely as not to contribute less than 50% of the recent warming

14  Should we reduce emissions to prevent warming?
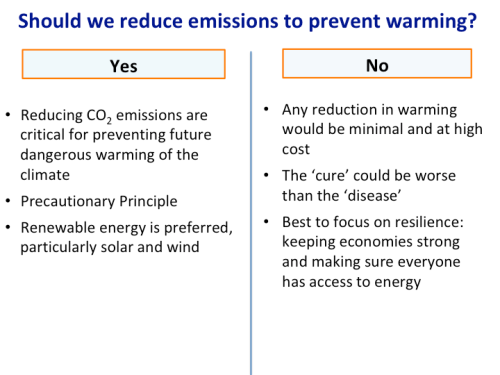
Even if you believe the climate model projections, there is still genuine disagreement regarding whether a rapid acceleration away from fossil fuels is the appropriate policy response.
One side argues that reducing CO2emissions are critical for preventing future dangerous warming of the climate.  The other side argues that any reduction in warming would be minimal and at high cost, and that the  ‘cure’ could be worse than the ‘disease’.

15   Climate pragmatism
What makes most sense to me is Climate Pragmatism, which has been formulated by the Hartwell group.  Climate pragmatism has 3 pillars:
  • Accelerate energy innovation
  • Build resilience to extreme weather
  • No regrets pollution reduction
These policies provide near-term socioeconomic & environmental benefits and have justifications independent of climate mitigation & adaptation
 These are no regrets policies that do not require agreement about climate science or the risks of uncontrolled greenhouse gases
16   Madhouse effect
I would like to make a few comments on the state of the scientific and public debate on climate change.
Here is my take on the Madhouse effect.  The madhouse that concerns me is one that has been created by climate scientists.  The madhouse is characterized by
  • Rampant overconfidence in an overly simplistic theory of climate change
  • Enforcement of a politically-motivated, manufactured ‘consensus’
  • Attempts to stifle scientific and policy debates
  • Activism and advocacy for their preferred politics and policy
  • Self-promotion and ‘cashing in’
  • Public attacks on other scientists that do not support the ‘consensus’
Hmmm . . . maybe I should write a book.