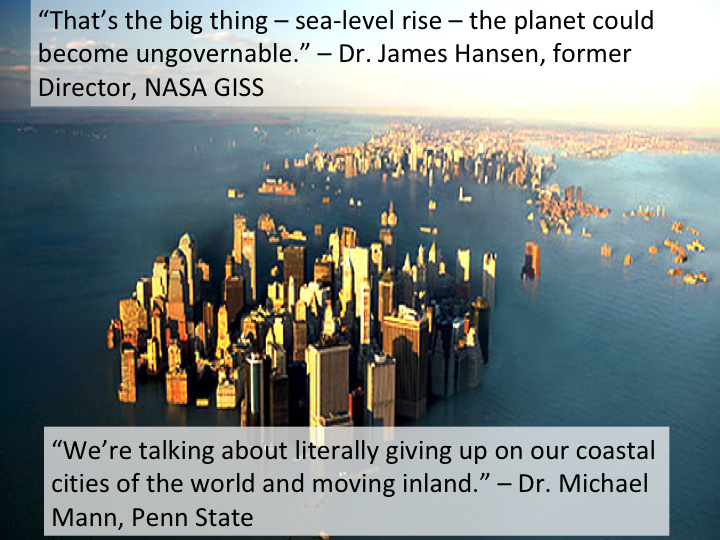
In a
2002 paper, what is
frequently referred to as “Munk’s enigma”, Scripps Institution of
Oceanography’s senior researcher bemoaned the fact researchers could not fully
account for the causes of sea level rise. He lamented, “the historic rise
started too early, has too linear a trend, and is too large.” Early IPCC analyses
noted about 25% of estimated sea level rise was unaccounted for. Accordingly, in
2012, an international team of prominent sea level researchers published,
Twentieth-Century
Global-Mean Sea Level Rise: Is the Whole Greater than the Sum of the Parts? (henceforth Gregory 2012). They hoped
to balance struggling sea level budgets by re-analyzing and adjusting estimates
of the contributions from melting glaciers and ice caps, thermal expansion, and
the effects of dam building and groundwater extraction. However, a natural
contribution from any imbalance in groundwater re-charge vs discharge was never
considered. Yet the volume of freshwater stored as groundwater, is second only
to Antarctica’s frozen supply, and 3 to 8 times greater than Greenland’s.
At the risk of oversimplifying, the effects of groundwater
storage can be differentiated between shallow-aquifer effects that modulate
global sea level on year to year and decade to decade timeframes, versus deep
aquifer effects that modulate sea level trends over centuries and millennia.
Researchers are increasingly aware of natural shallow groundwater
dynamics. As noted by
Reager (2016) in
A Decade of Sea Level Rise Slowed by Climate-Driven
Hydrology, researchers had determined the seasonal delay in the return of
precipitation to the oceans causes sea levels to oscillate by 17 ± 4 mm [~0.7
inches] per year. Reager (2016) also argued decadal increases in terrestrial
water storage driven by climate events such as La Nina, had reduced sea level
rise by 0.71 mm/year. Likewise,
Cazenave
2014 had published according to altimetry data, sea level had decelerated
from 3.5 mm/yr in the 1990s to 2.5mm/yr during 2003-2011, and that deceleration
could be explained by increased terrestrial water storage, and the pause in ocean
warming reported by Argo data.
Improved observational data suggest during more frequent La
Nina years a greater proportion of precipitation falls on the land globally and
when routed through more slowly discharging aquifers, sea level rise
decelerates. During periods of more frequent El Niños, more rain falls back onto
the oceans, and sea level rise accelerates. In contrast to La Nina induced shallow-aquifer
effects, deep aquifers have been filled with meltwater from the last Ice Age,
and that water is slowly and steadily seeping back into the oceans today.
Munk’s “Too Linear
Trend” Enigma and Deep Groundwater Discharge
Hydrologists concerned with sustainable groundwater supplies
and drinking water contamination, have been in the forefront of analyzing the volume
and ages of the world’s groundwater, providing greater insight into deep
aquifer effects.
Gleeson (2015) determined, “total groundwater
volume in the upper 2 km of continental crust is approximately 22.6 million
cubic kilometers, twice as much as earlier
estimates. If all 22.6
million cubic kilometers of freshwater stored underground reached the oceans,
sea level would rise 204 feet (62,430 millimeters). Via various isotope
analyses and flow models,
Jasechko (2017)
estimated that between 42-85% of all groundwater stored in the upper 1
kilometer of the earth’s crust is water that had infiltrated the ground more
than 11,000 years ago, during last Ice Age.
Clearly the earth’s groundwater has yet to reach an equilibrium
with modern sea levels. With deep aquifer discharge primarily regulated by
geological pore spaces (in addition to pressure heads), the slow and steady
discharge of these older waters affects sea level rise on century and
millennial timeframes. And, although freshwater discharge from deep aquifers
may be locally insignificant relative to river runoff, deep aquifer discharge
when integrated across the globe could account for the missing contribution to
the sea level rise budgets.
Unfortunately quantifying the groundwater discharge contribution
to sea level rise is extremely difficult, suffering from a low signal to noise
problem. That difficulty is why natural groundwater contributions are often
ignored or brushed aside as insignificant. Although GRACE satellite monitoring
of gravity changes offers great promise for detecting changes in terrestrial
groundwater storage, GRACE cannot accurately separate the relatively small
discharge of deep aquifers from large annual changes in shallow groundwater. In
periods of heavy rains, groundwater increases will mask deep aquifer discharge.
And during a drought, any deep groundwater discharge will likely be attributed
to the lack of rain.
However, estimates of groundwater re-charge via isotope
analyses can provide critical information regards rates of groundwater
re-charge and discharge.
Using the abnormal levels of tritium released during nuclear
testing in the 1950s, plus carbon14 dating,
researchers
have categorized the time since groundwater had last left the surface into 25,
50, 75 and 100-year old age classes. As expected, the youngest water is
concentrated in the shallowest aquifer layers and the proportion of young water
decreases with depth. The estimated volume of 25-year-old or younger
groundwater suggests global groundwater is currently recharging at a rate that
would
reduce sea level by 21 mm/year
(0.8 inches/year).
Water cycle researchers (i.e. Dai and Trenberth) have made the
dubious assumption that the amount of water transported via precipitation to
the land from the ocean is balanced each year by river runoff.
But if the tritium derived estimates are valid,
balancing water cycle and sea level budgets becomes more enigmatic. Clearly a
significant amount of precipitation does not return for decades and centuries.
Intriguingly, comparing the smaller volume of ground water
aged 50 to 100-years-old versus the volume of water 50-years-old and younger
suggests 2 possible scenarios. Either ground water recharge has increased in
recent decades, or if recharge rates averaged over 50 years have remained
steady, then as groundwater ages a significant portion seeps back to the ocean
at rates approaching 1.7 mm/year, a rate that is very similar to 20th
century IPCC estimates of sea level rise.
Groundwater discharge must balance recharge or else it directly
alters global sea levels. When less than 21 mm/year seeps back to the ocean,
then natural groundwater storage lowers sea level. When discharge is greater
than 21 mm/year, then groundwater discharge is raising sea level. Without
accounting for recharge vs discharge, the much smaller estimates of all the other
factors contributing to sea level rise are simply not well constrained.
Higher rates of discharge could account for the enigmatic
missing sea level contributions reported by the IPCC and other researchers (i.e.
Gregory 2012). More problematic, if
discharge proves to significantly exceed recharge, then estimates of contributions
from other sources such as melting ice and thermal expansion may be too high. What
is certain, the current estimates of contributions to sea level from melting
ice and thermal expansion only range from 1.5 to 2.0 mm/year, and those factors
by themselves cannot offset the tritium estimated 21 mm/year of groundwater
recharge. So, what is missing in our current water cycle budgets?
The Importance of Submarine Groundwater Discharge (SGD)
The recharge-discharge imbalance can be reconciled if water
cycle budgets included the difficult-to-measure rates of prolific submarine
groundwater discharge (
SGD). Freshwater
springs bubbling up from coastal sea floors have long been observed. To
reliably replenish drinking water, Roman fisherman mapped their occurrences
throughout the Mediterranean.
Moosdorf (2017)
has reviewed the locations and many human uses of fresh
submarine groundwater discharge around the world.
Recent ecological studies have measured local submarine
groundwater seepages to determine contributions of solutes and nutrients to
coastal ecosystems. But those sparse SGD measurements cannot yet be reliably
integrated into a global estimate.
Rodell
(2015) notes that most water cycle budgets have ignored SGD due to its
uncertainty, so Rodell’s water cycle budget included a rate of SGD equivalent
to 6.5 millimeters/year (~0.25 inch/yr) of sea level rise. However, that estimate
is still insufficient to balance current recharge estimates.
However, with improving techniques, researchers
recently estimated total submarine groundwater
(saline and fresh water combined) discharges suggesting a rate
3 to 4 times greater than the observed
global river runoff, or a volume equivalent to 331 mm/year (13 inches) of sea
level rise. Nonetheless more than 90% of that submarine discharge is saline sea
water, most of which is likely recirculated sea water, and not likely to affect
sea level. Only the fraction of entrained freshwater would raise sea level. To
balance the 21 mm/year ground water recharge, between 6 and 7% of total SGD must
be freshwater and that amount is very likely. Local estimates of the freshwater
fraction of submarine discharge range from 1 to 35%, and on average just less
than 10%. If fresh submarine groundwater discharge approaches just 7% of the
total SGD, it would not only balance current groundwater recharge, but would steadily
raise sea level by an additional 2 mm/year, even if there was no ocean warming and
no melting glaciers.
A Sea Level Rise “Base-flow”
and Paleo-climate Conundrums
Hydrologists seek to quantify the aquifer contributions to
river flow, otherwise known as the “base flow”. During the rainy season or the
season of melting snow, any groundwater contribution is masked by heavy surface
runoff and shallow aquifer effects. However, during extended periods of drought
hydrologists assume the low river flow that persists must be largely attributed
to supplies from deeper aquifers. Streams that dry up during a drought are
usually supported by small shallow aquifers, while reduced but persistent river
and stream flows must be maintained by large aquifers. Using a similar conceptual
approach, we can estimate a possible “base flow” contribution to sea level.
When the continental ice sheets began to melt as the earth
transitioned from its Ice Age maximum to our present warm interglacial, sea
level began to rise from depths ~130 meters lower than today (see graph below).
Melting continental ice sheets drove much higher rates of sea level rise than seen
today, ranging from 10 to 40+ mm/year. Approximately 6,000 years ago, a
consensus suggests the last of the continental ice sheets had melted completely,
the earth’s montane glaciers had disappeared, and Greenland and Antarctic ice
sheets had shrunk to their minimums. The earth then entered a long-term 5000-year
cooling trend dubbed the
Neoglaciation.
Although sea level models forced only by growing glaciers and cooling ocean
temperatures would project falling sea levels, proxy evidence enigmatically suggests
global sea level continued to rise. Albeit at reduced rates, global sea level continued
to rise another 4 meters (Figure 1 below). Although there is some debate
regards any continued contribution from Antarctica and “ocean siphoning”, according
to
Lambeck 2014 about 3 meters of sea level
were added between 6.7–4.2 thousand years ago. That continued sea level rise
could be explained by aquifer discharge, suggesting a minimal “base flow” of ~1.2
mm/year from groundwater discharge.

Similarly, during the Little Ice Age between 1300 and 1850 AD,
montane glaciers as well as Greenland and Antarctic ice sheets, grew and reached
their largest extent in the last 7,000 years. Ocean temperatures cooled by about
1 degree. Yet inexplicably, most researchers estimate global sea level never
dropped significantly. They report sea levels were “stable” during the Little
Ice Age, fluctuating only by tenths of a millimeter. That stability contrasts greatly
with the recent rising trend, that has led some to attribute the current rise
to increasing CO2 concentrations. However Little Ice Age stability defies the physics
of cooling temperatures and increasing water storage in growing glaciers that should
have caused a significant sea level fall. However, that seeming paradox is consistent
with a scenario in which a “base flow” from groundwater discharge would offset any
transfer of waters to growing Little Ice Age glaciers.
Once the growth of Little Ice Age glaciers stopped, and
groundwater base flow was no longer offset, we would expect sea levels to rise
as witnessed during the 19th and 20th centuries. Such a
scenario would also explain Munk’s enigma that sea level rise had started too
early, before temperatures had risen significantly from any CO2-driven warming.
Interestingly, assuming a ballpark figure of a 1.2 mm/year groundwater
base flow, unbalanced groundwater discharge could also explain the much higher
sea levels estimated for the previous warm interglacial, the Eemian.
Researchers estimate sea levels ~115,000 years ago were about 6 to 9 meters
higher than today. That interglacial has also been estimated to have spanned
15,000 years before continental glaciation resumed. Compared to our present interglacial
span of 11,700 years, an extra 3,300 years of groundwater discharge before being
offset by resumed glacier growth, could account for 4 meters of the Eemian’s higher
sea level.
Recent glacier meltwater contribution to sea level is
likely overestimated?
In addition to a groundwater base flow driving the current
steady rise in sea level, meltwater from retreating Little Ice Age glaciers undoubtedly
contributed as well. But by how much?
Researchers have
estimated there was greater glacial retreat (and thus a greater flux of
meltwater) in the early 1900s compared to now. So, current glacier retreat is
unlikely to cause any acceleration of recent sea level rise. Furthermore, we
cannot assume glacier meltwater rapidly enters the oceans. A large proportion
of meltwater likely enters the ground, so it may take several hundred years for
Little Ice Age glacier meltwater to affect sea level.
How fast can groundwater reach the ocean? Groundwater
measured in the Great Plains’ Ogallala Aquifer can flow at a higher-than-average
seepage rate of ~300 mm (~1 foot) in a day, or about the length of a football
field in a year. For such “fast” moving
groundwater to travel 1000 kilometers (620 miles) to the sea, it would require
over 10,000 years! Most ground water travels much slower. The great weight of
the continental glaciers during our last ice age, applied such great pressure
that it forced meltwater to into the ground at much greater rates than
currently observed recharge. And that Ice Age meltwater is still slowly moving
through aquifers like the Ogallala.
(However, its release to the ocean has been sped up by human
pumping.
Recent
estimates suggest that globally, human groundwater extraction currently
exceeds rates of water capture from dam building, so that groundwater depletion
is now accelerating sea level rise.)
How much of the current meltwater can we expect to transit
to the ocean via a slow groundwater route? That’s a tough question to answer.
However, thirteen percent of the earth’s ice-free land surface is covered by
endorheic basins as illustrated by the gray areas shown in the illustration
below.
Endorheic basins have no direct outlets to the ocean. Water entering
endorheic basins only return to the sea via evaporation, or by the extremely slow
route of groundwater discharge. Any precipitation or glacial meltwater flowing
into an endorheic basin could require centuries to thousands of years to flow
back to the oceans.
For example, in 2010-2011, researchers reported that a La
Nina event had caused global sea level to
fall
by the equivalent of 7mm/year (~0.3 inches/year). That dramatic drop happened
despite concurrent extensive ice melt in
Greenland and despite any base flow contribution.
As described by
Fasullo
(2013), GRACE satellite observations detected increased groundwater storage
caused by higher rates of rainwater falling on
endorheic basins, primarily in Australia. Although satellite
observations suggested much of the rainwater remained in the Australian basin,
sea level resumed its unabated rise as groundwater base flow contribution would
predict.

To balance their sea level budgets, researchers assert
melting glaciers have added ~0.8 mm/year to recent sea level rise. The 20th
century retreat of most glaciers is undeniable, but we cannot simply assume all
20th century glacier meltwater immediately reached the oceans. The
greatest concentration of ice, outside of Greenland and Antarctica, resides in
the regions north of India and Pakistan, in the Himalaya and Karakoram glaciers.
Most melt water flowing northward enters the extensive Asian endorheic basins. Likewise,
some of the Sierra Nevada meltwater flows into Nevada’s Great Basin, and some
Andes meltwater flows into the endorheic basins of the Altiplano and Lake
Titicaca as well as the Atacama Desert. It is very likely much of the current glacial
meltwater will then take decades to millennia to reach the ocean and has yet to
impact modern sea levels. If the glacial melt water contribution to sea level
is overestimated, then, the unaccounted-for contribution to sea level rise
becomes much larger than initially thought.
Accurate Attribution of Groundwater Discharge and Recharge Will Constrain
Sea Level Contributions
Using a combination of GRACE gravity data that measured changes
in ocean mass, altimetry data that measured changes in ocean volume and Argo
data that measured heat content,
Cazenave
(2008) used 2 different methods and both estimated the contribution from
increased ocean heat to be about 0.3 to 0.37 mm/year.
Jevrejeva
(2008) calculated a similar heat contribution. Other researchers suggest
thermal expansion contributes 1.2 to 1.5 mm/year (i.e.
Chambers 2016).
Such large discrepancies reveal contributing factors to sea level rise are not yet
reliably constrained.
One of the great uncertainties in sea level research are
glacial isostatic adjustments.
Researchers have subjectively adopted various
Glacio-isotatic adjustment models with recommended adjustments ranging from 1
to 2 mm/year. For example, although GRACE gravity estimates had not detected
any added water mass to the oceans, Cazenave (2008) added a 2 mm/year
adjustment, as illustrated from her Figure 1 below. Other
researchers
only added a 1 mm/yr adjustment.
1)
Assume the
contribution from glacier melting was greater than previously estimated.
But
greater
melting rates were documented for the 30s and 40s, and the likelihood that
some glacier meltwater is still trapped as groundwater, suggests the glacier
meltwater contribution has been overestimated.
2)
Assume an
increased contribution from thermal expansion.
3)
Assume Greenland
positively contributed to sea level throughout the entire 20th
century.
Greenland has undoubtedly
contributed to episodes of accelerating and decelerating sea level changes, but
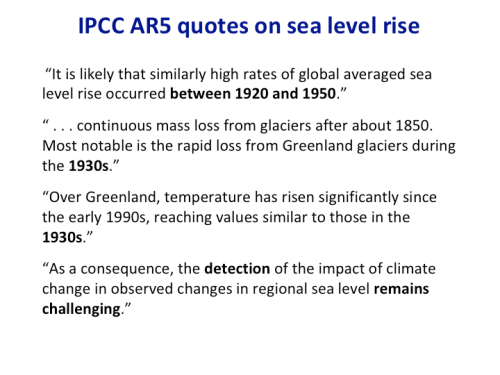
the greatest rate of Greenland warming occurred during the
1920s
and 30s.
Previous
researchers suggested Greenland glaciers have oscillated during the 20
th
century but had been stable from the 60s to 1990s.
Although there was increased surface melt in
the 21
st century, culminating in 2012, that melt rate has since declined.
And according to the
Danish
Meteorological Institute, Greenland gained about 50 billion tons of ice in
2017 which should have lowered sea level in 2017.
Clearly Greenland cannot explain the
enigmatic steady 20th century sea level rise.
4)
Assume
reservoir water storage balanced groundwater extraction.
But
net
contributions from groundwater extraction vs water impoundments and other
landscape changes are still being debated. For
the period 2002–2014 landscape changes have
been estimated to have reduced sea level by −0.40 mm/year versus IPCC
estimates of contributing 0.38 mm/year from 1993–2010 to sea level rise.
5)
Assume
the remaining unaccounted contribution to sea level rise is small enough to be
attributed to melting in Antarctica.
Debatably, Antarctic melting is too
often used as the catch-all fudge factor to explain the unexplainable. Furthermore,
there is
no
consensus within the Antarctic research community if there have been any human
effects on Antarctica’s ice balance. Regions that are losing ice are balanced
by regions that are gaining ice. Claims of net ice loss have been countered by
claims of net ice gain such as
NASA
2015. Additionally, unadjusted GRACE gravity data has suggested no lost ice
mass and all estimates of ice gains or loss depend on which Glacial Isostatic
Adjustments modelers choose to use. We cannot dismiss the possibility that
unaccounted for groundwater discharge has been mistakenly attributed to hypothetical
Antarctic melting?
A better accounting of natural groundwater discharge is
needed to constrain the range of contributions to sea level rise suggested by researchers
such as Gregory 2012. The greater the contribution from groundwater discharge,
the smaller the adjustments used to amplify contributions from meltwater and
thermal expansion. Until a more complete accounting is determined, we can only
appreciate Munk’s earnest concern. How can we predict future sea level rise if
we don’t fully understand the present or the past?