Below is the transcript to the video
The Big 5 Causes of Natural Climate Change part 4 Landscape Changes
available at https://youtu.be/ja6ZRgntPsg
Welcome everyone
This is part 4 of the big 5 natural causes of climate change. In parts one thru 3 we detailed how ocean currents warmed the Arctic, how more La Ninas were warming the oceans and affecting jet streams. Here I examine the dynamics that warm the land.
Although most landscape changes are caused by humans, the intent here is show how landscape changes largely account for the land's temperature trends that have been incorrectly blamed on rising CO2.
Despite the cooler global average temperature, the earth's highest recorded temperature, 56.7 Celsius or 134 Fahrenheit was set in California’s Death Valley in 1913, due to landscape features present in most desert ecosystems.
Less vegetation and bare desert soils heat surfaces to greater extremes. You have likely experienced a similar effect when walking barefoot in the summer on a cool grassy surface and then, stepped onto burning asphalt pavement.
Dry regions also produce fewer clouds allowing greater solar heating than elsewhere.
The same amount of energy can raise the temperatures of dry surfaces much more than moist surfaces. And dark soils, reflect less and so absorb more solar energy than other surfaces
Similarly, urban heat islands form in part because urban development has created desert-like conditions.
Because urban heat islands amplify every heat wave and set new records, people living in urban centers are more easily seduced into accepting climate crisis narratives than people living in cooler rural regions.

The temperature of the air is determined by the temperature of the earth's surfaces.
1. The sun primarily heats the earth's surface, not the air
2. The air then gets heated by contact with the earth's heated surface.
And that warmed air rises and warms the atmosphere above
3. At higher altitudes, the rising air radiates heat back to space and cools and sinks back to the surface
Any large- or small-scale conversions of ecosystems from forests to grasslands or grasslands to deserts increases the earth's skin surface temperatures.

With the advent of the satellite era, we now have global coverage of the earth's skin surface. But skin surface temperatures can be as much as 30 degrees Celsius hotter than conventional air temperatures measured 5 feet above the surface. This map of the earth's land surface maximum temperatures illustrates how solar heating and landscapes combine to determine skin temperatures
As expected, the coldest regions are at the poles represented in dark blue. But surprisingly for most people, the hottest maximum temperatures are not recorded at the equator, but elsewhere due to landscape effects.
This graph correlates the earth's ecosystems with surface temperatures.

Forest ecosystems cover the greatest area. The northern forest across Canada and Eurasia experience maximum temperatures centered around 20 degrees Celsius or 68 degrees Fahrenheit and the equatorial forests reach maximums centered around 30 Celsius or about 86 Fahrenheit.
Grasslands typically experience higher maximum temperatures, spanning 30 to 50 degrees Celsius. The prairies of north America illustrated in yellow are warmer than north Americas eastern forests but cooler than the western deserts
The hottest maximum temperatures are recorded in the deserts spanning 45 to 70 degrees Celsius. Death Valley's 56.7 Celsius record air temperature was observed in 1913. In 1922, 57.8 degrees Celsius was recorded in the desert of Libya breaking the Death Valley record.
However, because these extreme air temperatures happened 100 years ago and conflict with CO2 climate narratives, some researchers speculated that Libya’s temperature must have been incorrectly recorded, so successfully lobbied to remove it from the record books. There have been ongoing similar attempts to erase Death Valley's record temperature. Clearly those who control the present narratives, control the past.
Now with satellites measuring skin surfaces, the record hottest skin surface temperature of 70.7 Celsius (about 160 Fahrenheit) was recorded in 2005 in Iran’s Lut Desert, but it's not clear what the air temperature would have been.
The reason different ecosystems experience such different temperatures, even at the same latitude, is because of moisture.

The same amount of energy required to raise one gram of water one degree Celsius, measured here in joules, can also raise dry air by 4 degrees.
The same amount of energy that increases wet soil by one degree raises dry soil by 2 degrees
Likewise, that same amount of energy would raise asphalt by 2 degrees. In addition, asphalt and other dark surfaces absorb more energy.
Finally, 2200 times more energy is required to evaporate one gram of water without changing the temperature. Without moisture to evaporate, that energy instead causes surface temperatures to rise.

Any loss of vegetation, such as converting a forest ecosystem to an urban setting, will reduce evaporation and moisture, and thus generate heat islands.
Wetlands around the world have been increasingly drained and dried since global warming began in the 1800s.

In the 1800s California’s central valley was considered a marsh land represented by the yellows and greens. By the 1990s, over 90% of California’s wetlands were drained and dried. Irrigation has only partially offset the resulting warming effects
The most severe loss of wetlands in the United States are colored red. And the percentage of lost wetlands in each state is listed here.

California’s 91% loss was the greatest, but similar losses were observed in the Midwest from Iowa to Arkansas to Ohio. Florida only lost 46% of its wetlands but nearly 90% of the everglades.

Such losses were not confined to the USA. Globally 87% of surveyed wetlands have been lost since the 1700s. And that loss continues today.

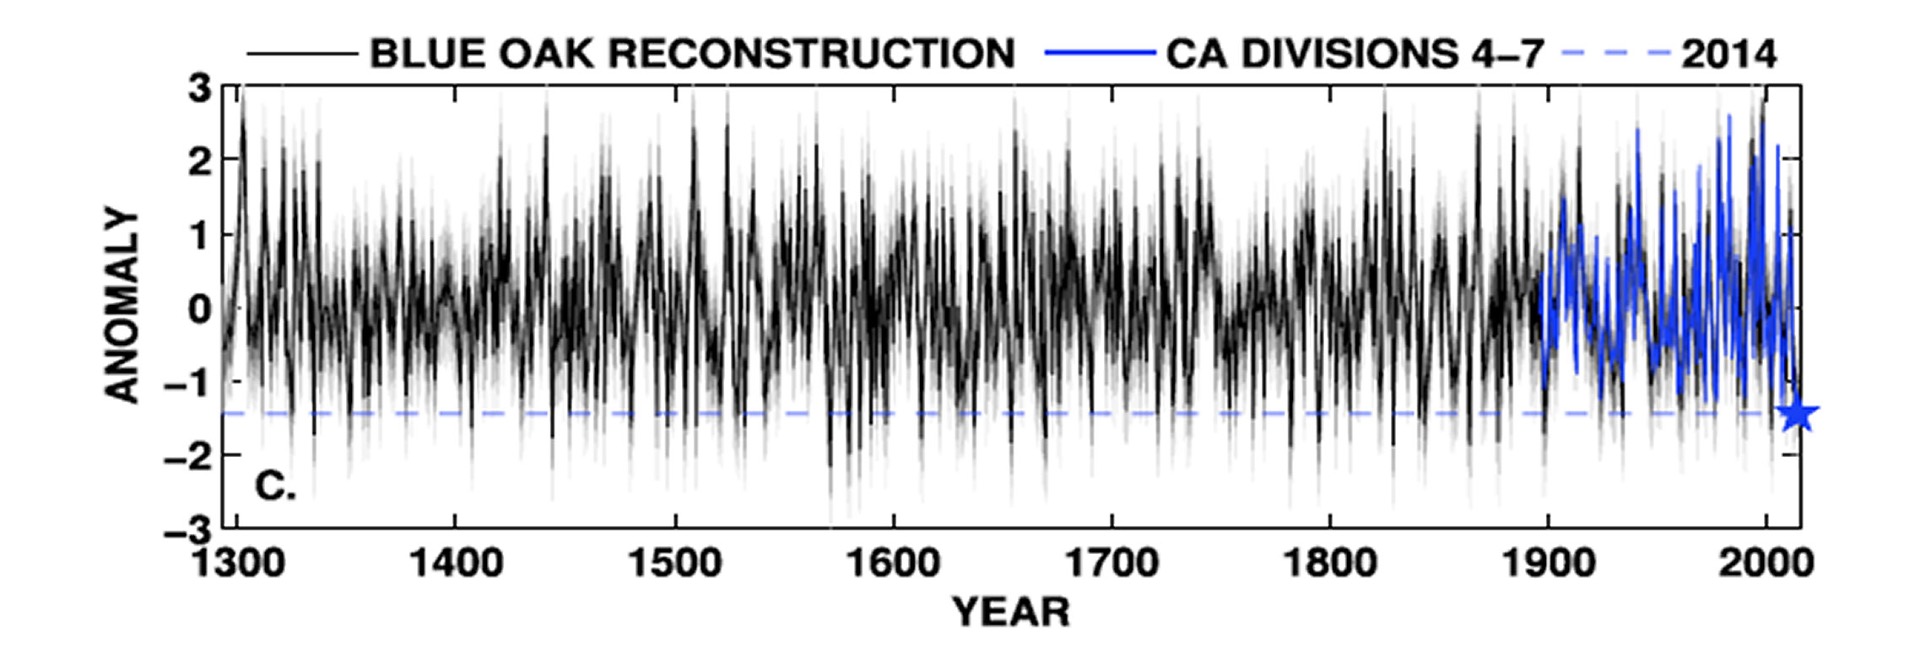
Based on reconstruction of tree rings, there has been no change in the natural variations in rainfall, so increasing dryness has not been driven by human climate change. Griffin, in 2014, reconstructed rainfall patterns for the past 700 years from blue oak tree rings. The blue star and dashed line represent California’s extreme 2014 drought. The reconstruction revealed similar droughts happened about 3 times every century and some have been far worse than 2014, even during the colder Little Ice Age.
In addition to lost wetlands, degraded landscapes have reduced natural cooling that happens via transpiration. Over 60 to 80% of the globe's dry lands have been degraded by deforestation and overgrazing.

As human populations expanded by 7-fold since 1800, the demand for wood for heating and buildings grew, causing the area of deforestation to double.
In 2021, researchers from the US Forest Service compared the effects of the 2021 heat wave on undisturbed forests versus deforested and degraded forests.
In west Oregon undisturbed forests were 5.5 degrees Celsius (or 10 degrees Fahrenheit) cooler. Likewise in Washington state, the degraded forest plantations were 4.5 degrees warmer.
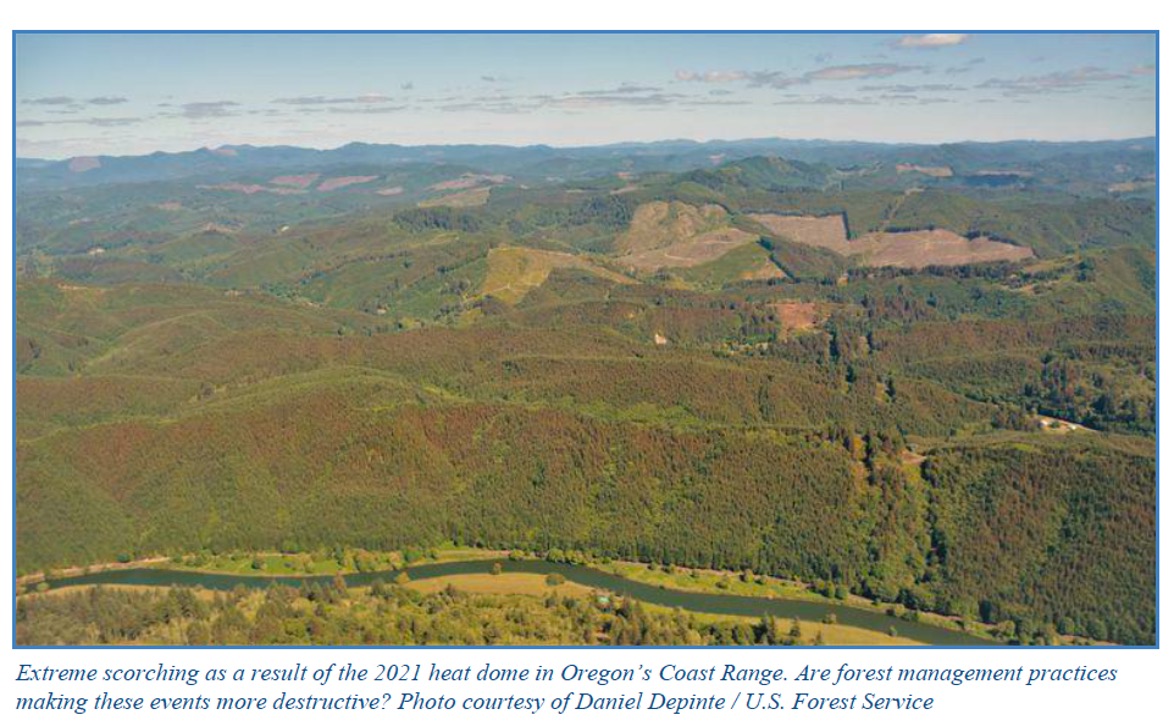
Thus, researchers concluded, "the loss and degradation of primary forests was driving regional climate change and amplifying the severity of heat waves and droughts.
This graphic illustrates the regions where deforestation and forest fragmentation have taken the greatest toll. (rust colored). Between 2002 and 2020 as populations grew, China lost over 6% of its forests
Southeast Asia, largely in Malaysia and Indonesia, have lost huge swaths of forest because misguided politics are subsidizing biofuels and promoting deforestation to plant palm oil.

In contrast, Scandinavia exhibits no fragmentation and a growing forest, and it has not experienced global warming
By reconstructing temperatures using Scandinavian tree rings, Esper 2012 concluded temperatures have been declining for the past 2000 years. The 3 warmest 30-year periods happened during the Roman Warm Period 2000 years ago, and the Medieval Warm Period 1000 years ago. Both were warmer than the recent 30-year warm period between 1920 and 1940.

Overgrazing has likewise warmed the land's surface skin temperatures. A 1994 study found overgrazed grasslands were 2 to 4 degrees Celsius warmer than well managed grasslands. and overgrazed north American grasslands were warming 63% faster than well managed grasslands.

The loss of grasslands in the 1930s contributed to the deadly Dust Bowl.
In contrast to the false narrative that global warming is causing more fires, more fires are, however, changing the landscapes, reducing transpiration, and warming the land. Southern California’s Malibu Canyon suffers 2 fires each decade as result of human ignitions.That has resulted in the loss of shrub lands, converting them into invasive grasslands that are both more easily ignited and increase skin surface warming

While studies show humans start over 84% of all wildfires, along California’s central and southern coasts, the growing human population has started 100% of the fires

To what degree these landscape changes bias the global average temperature upwards, depends on the proximity to any landscape changes, of the weather stations that contribute to that average,
As of 2011, the World Meteorological Organization oversees 11,119 weather stations, and to easily operate them these stations are associated with human habitat, not wilderness. The United States has the densest coverage and the most stations operating for 75 years or more (represented by red dots), the minimum time span needed to assess natural vs human climate changes.

For the rest of the globe, that coverage averages out to just one station for each area the size of the state of Connecticut. And that one weather station is assumed to represent all temperatures in the surrounding 5,000 square miles.
Urban areas represent less than 1% of the entire land surface of earth. However, 27% of the weather stations used to calculate climate change are in urban areas.
Urban heat islands are typically 2 to 3 degrees Celsius, or 5 to 6 degrees Fahrenheit, warmer than surrounding, well-vegetated suburban and rural regions. Urban heat islands are typically created by reducing vegetation and removing rainfall into storm drains while paving over moist soils and wetlands with asphalt and concrete.

Oddly, some studies, simply based on population size, argue rural and urban areas are equally warming and so blame rising temperatures on CO2. But those studies ignore the fact that even with smaller populations, rural areas are warming due to lost wetlands, deforestation, and overgrazing.
To robustly evaluate the warming effects of CO2, new studies must be done that account for the effects of those landscape changes,


These NASA photographs show the effect of urban centers versus more vegetated suburbs seen in green. The infrared photo shows the well vegetated suburbs are 10 degrees Celsius or 18 degrees Fahrenheit cooler
Again, it is no coincidence that it is typically urban dwellers suffering from urban heat islands who mistakenly support political parties that push a global warming climate crisis.
In addition to adding more vegetation, one solution to reduce urban heat islands, requires converting dark rooftops to white roof tops

Dark roofs absorb 16 times more heat than white surfaces. And hotter roofs generate hotter buildings
Dark roofs heat the atmosphere 4 times more than white surfaces Additionally hotter buildings emit more heat through the night increasing the nighttime minimum temperatures.
In 1988, Thomas Karl, who later became director of the National Climatic Data Center, published research showing that as an urban center's population increased, so did the early morning minimum temperatures, but not maximum temperatures

In a town of 10,000 people, the minimum temperature increased twice as much as a small-town of 2000 people. In a city of one million people, the minimum temperature increased 15 times more than the small town.
And although maximum temperatures decreased, the city's average temperature still increased 15 times more than the small town. As cities grow the altered landscape, added buildings, and streets of asphalt will store more daytime heat, which is then slowly released at night, and that best explains the asymmetric temperature trends.
Trying to evaluate how temperatures were affecting Sierra Nevada wildlife, I examined the temperature data from the nearest us historical climate network station in Tahoe City. Unexpectedly, but like Karl’s study, I found the maximum temperatures were highest in the 1930s and have been cooling since But minimum temperatures had been rising.

The Sierra Nevada was not getting hotter. Surfaces were just cooling less by early morning
Unfortunately, the commonly paraded temperature trends only present the average of the maximum and minimum and that misleading statistic hides the grossly different temperature dynamics.

Minimum temperatures are more sensitive than maximums to surface changes due to differences in daytime and nighttime convection. Solar heating during the day generates robust convection that carries heat away from the surface and upwards, to mix with cooler air above.
During the night, convection is greatly reduced so that air warmed at the surface is not diluted by mixing with cooler air above. Inversion layers often form that can trap heat, even preventing smoke from rising.

In 2013 I published this graph in my book of temperatures in Death Valley, from data supplied by the us historical climate network. The climate trends were very similar to that observed in the Tahoe City data and elsewhere in California, with the maximum temperatures peaking in the 1930s.
Death Valley's weather station shows it was sited in a more natural landscape in 1913 when its record maximum temperature was recorded, even though minimum temperatures were much lower.

As meteorologist Anthony Watts and his Surface Station surveys have revealed, even Death Valley has been affected by landscape changes. As Death Valley became a National Park and popular tourist spot, a visitor's center and several RV parks were added around the weather station. The observed rise in minimum temperature is again consistent with those land surface changes.

Death Valley is also a symbol of how fragile our temperature data has become as politics can outweigh science. The data I published had been previously adjusted for any known errors.
It was consistent with California’s regional climate trends observed in Tahoe city and Yosemite national park as well as other stations around the country.

Peak maximum temperatures were consistent with the EPA’s heat wave index that also peaked in the 1930s.

But in 2014, I got an email accusing me of misrepresenting the Death Valley data. When I checked, I found Death Valley’s data had been adjusted once again, and this time the 1930s warm peak was squashed
And Death Valley's temperature trend was now structured to align with the current CO2 global warming narratives.

Clearly those who control the present, control the past.
Up next: part 5 of the big 5 natural causes of climate change: clouds . Until then.... Embrace renowned scientist Thomas Huxley’s advice....
Skepticism is our highest of duties and blind faith the one unpardonable sin!