Welcome everyone
Heat waves provide the perfect optics for those who want to push climate alarmism arguing CO2 is causing the world to dramatically overheat.
Using uncontested physics and published peer reviewed evidence I will conclusively show heat waves are all natural. So today in part 5 of how pressure systems control climate, I examine how natural shifts in the location and duration of high-pressure systems cause heatwaves.
Various researchers will define heatwaves differently depending on the hypotheses they want to support.
But the American meteorological organization defines a heat wave as a weather event during which maximum temperatures are 5+ degrees Celsius higher than average on those dates and lasts for 5+ consecutive days
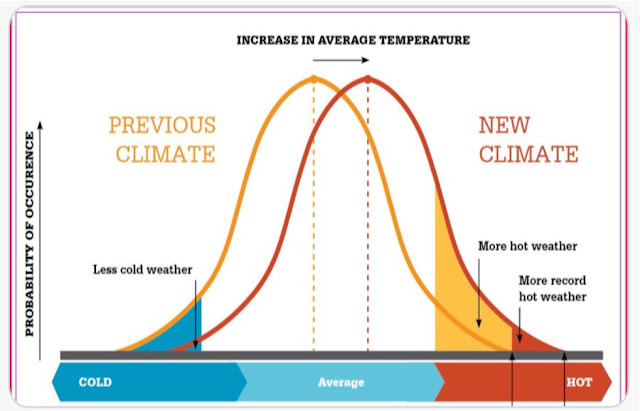
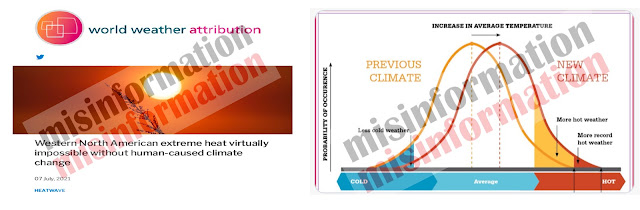
Researchers that push a CO2 driven climate crisis, argue that it is the shift in the average global temperature that results in more extreme heat waves and more record high temperatures.
But that is misinformation. Any honest and critical thinker will readily see the peak in USA heatwaves, as illustrated by the EPA, happened in the 1930s and there is no correlation with the global warming trend.
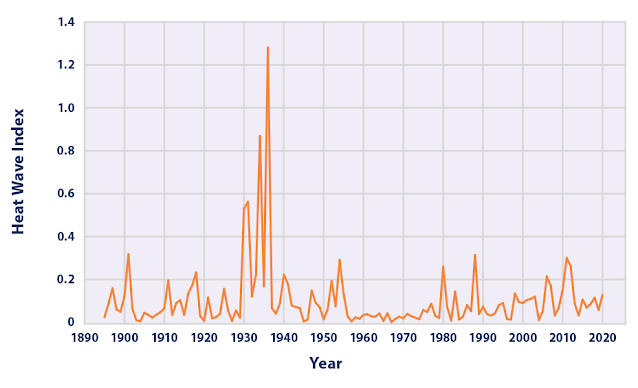
Clearly heatwaves and extreme temperatures are caused by factors other than changes in the global average temperature statistic. Such a false manufactured statistical argument is why Mark Twain's quip that there are” lies, damn lies and statistics” has resonated for over a century.
To put heat waves and extreme temperatures into perspective we first see that the theoretical maximum ground surface temperature has been estimated to lie between 90 and 100 Celsius or 194 to 212 Fahrenheit.
The air temperatures used to generate a global average are primarily heated by contact with the earth's solar heated surfaces, air temperatures correlate with ground temperatures but are 30 to 50 degrees Celsius cooler.Based on that difference we can infer the theoretical maximum air temperatures should lie between 50 and 60 Celsius or 122 and 140 Fahrenheit.
The science of heatwaves and maximum temperatures have determined 5 basic factors to evaluate any trends
- First, maximum temperatures are determined by the overhead angle of sunlight which is greatest in the tropics, clear skies permit maximum insolation but are greatest in the subtropics under high pressure systems.
- Second, because air is heated by contact with the ground, changes in surface conditions are very important. Dry surfaces heat to much higher temperatures than moist surfaces without any added solar or greenhouse heating
- Third temperatures in descending air currents also increase temperature without any added heat energy due to increasing pressure. As witnessed under high pressure systems and foehn winds.
- Fourth changes in mixing can also increase air temperatures without any added solar or greenhouse heating. For example, warm air transported from the Sahara Desert has raised temperatures during Europe’s heatwaves
- Finally, there is the balance between radiative heating and radiative cooling. Climate crisis narratives suggest increased CO2 slows the escape of infrared heat energy, reducing the rate of cooling and thus warming the earth. But counter-intuitively, outgoing infrared heat energy increases, Due to the dry conditions beneath high pressure systems, thus reducing any greenhouse effect.

The most intense solar heating happens in the tropics and least in the polar regions.
The direct rays of the sun are overhead and concentrated during the northern hemisphere's summer shifting as far north as 23.5 N degrees then traveling to 23.5 S degrees for the southern hemisphere's summer. This swath of latitudinal heating from the most intense sunlight defines the tropics, but due to cloudiness the earth's most extreme temperatures don't happen in the tropics.
North America’s and also the world's record for the hottest extreme temperature ever measured is
56.6 Celsius or 134 Fahrenheit measured in Death Valley located in the sub-tropics at 36 degrees north on July 10, 1913.
This century old record again refutes any correlation with global average warming trend. It is likely this record has not been broken because it lies close to the theoretical maximum caused by the combineD dynamics previously outlined.
Africa's record maximum is 55 degrees Celsius or 131 Fahrenheit on July 7, 1931, in Tunisia at 32 degrees north.
Asia's record maximum of 54 degrees Celsius or 129.2 Fahrenheit happened in Israel on June 21, 1942, at 32 degrees north.
These extreme temperatures all happened within weeks of the summer solstice, during a colder global average temperature, and in the subtropics where dry desert conditions, and cloudless high-pressure systems prevail.
Europe's record maximum happened in Athens Greece on July 1977
Australia's record of 50.7 Celsius or 123.3 Fahrenheit happened in January 1960 in Oodnadatta Australia
that claims to be the driest town in the driest state of the driest continent
Science clearly explains the contribution of dryness to extreme temperatures
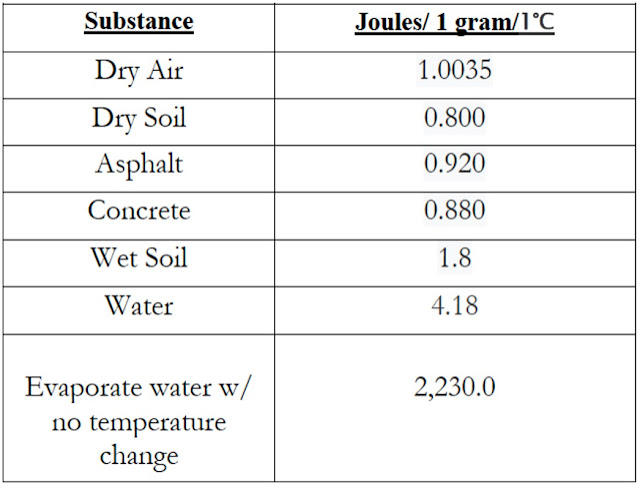
Dry soil requires just 0.8 jouleS of energy to raise a gram of dry soil by one degree. In contrast wet soil requires more than twice that energy to raise a gram by one degree.
In addition, over 2200 joules are required to evaporate a gram water without raising its temperature causing evaporative cooling. Without adding any heat energy from the sun or greenhouse gases, increasing dryness raises local temperatures.
Again, illustrating why temperature change is not a reliable indicator of increased greenhouse warming.
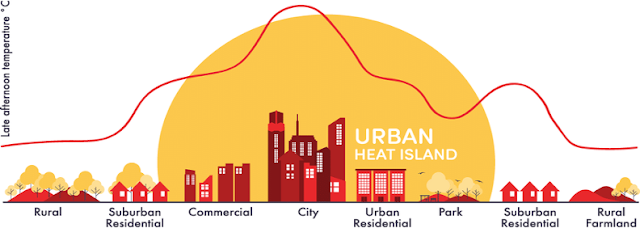
The much higher temperatures measured in big cities is called the urban heat island effect, which amplifies the public's suffering during a heat wave. The urban heat island effect is caused in part by the drying of the landscape as rains are quickly diverted into storm sewers instead of moistening the ground. In addition, the landscape is increasingly covered in asphalt and concrete which takes less energy to heat and holds that heat longer.
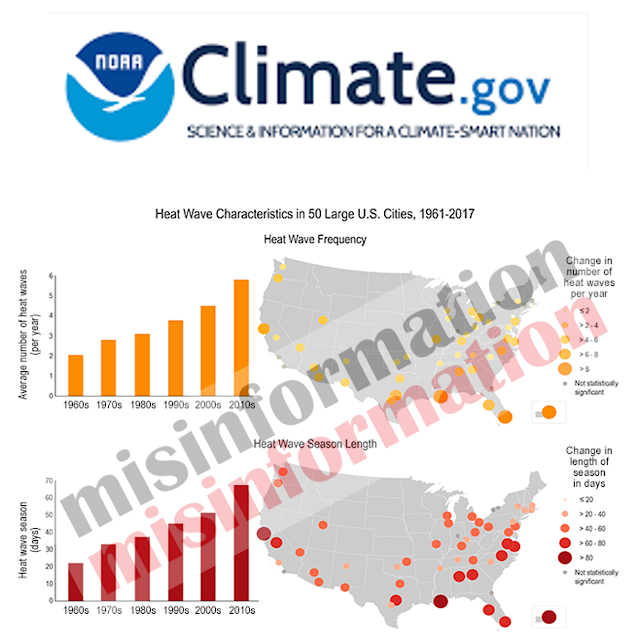
Those who push a climate crisis often use this graph of warming temperatures in the USA’s 50 large cities from climate.gov But to claim that warming trend is due to rising co2 is misinformation that ignores the increasing drying effects
Foehn winds are another example of higher temperatures that are not caused by added solar or greenhouse warming, but warm adiabatically solely due to increasing air pressure.
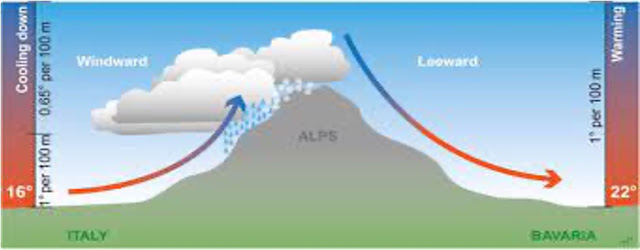
Moist air approaching a mountain are forced upwards on the windward side. The release of latent heat from condensing water vapor helps the air rise. On the leeward side as the air descends it warms to several degrees warmer than on the windward side solely due to increasing pressure.
The record temperature of 18.3 Celsius or 64.9 Fahrenheit for Antarctic happened on February 6, 2020,
much to the delight of the co2 climate crisis crowd. But this record was caused by a foehn wind descending on the Esperanza base which is located at the tip of the Antarctica peninsula, the continent's most equator-ward location.
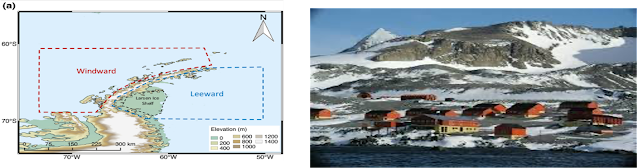
Depending on the strength and attack angle of the westerly winds, the winds will travel around the peninsula or at other times go up and over the peninsula's mountains. The Antarctic record temperature was simply an example natural adiabatic heating.
High pressure systems are created by dry descending air currents that also heat the air adiabatically the same as foehn winds

High pressure systems are almost always associated with a heat wave. The dry descending air creates clear skies that allow more solar heating. In addition, the adiabatically warmed descending air prevents warm surface air from rising and mixing with cooler air creating a heat dome, analogous to the heating of a car with its windows rolled up.
With the age of satellites, we can now measure changes in outgoing long-wave radiation (OLR) while surface weather stations measure incoming solar radiation at the surface.
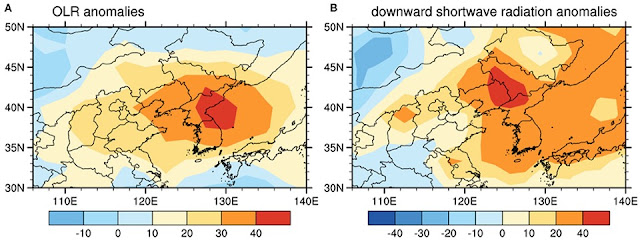
As illustrated here, during a heatwave in China, the yellow to red colors represent increased downward solar radiation and increased outgoing long-wave radiation measured in watts per meter squared. One watt is equal to one joule of energy per second. Compared to about just 2 W/m2 of CO2 downward heat, the center of this heat wave here, exhibited an increase of 30 to 40 outgoing watts/m2, suggesting a decreased greenhouse effect during a heat wave due to drier air.
In fact, scientists using satellite data, look for such increases in outgoing infrared to determine the location, intensity, and extent of heatwaves around the world.
The heating around the equator causes rising air that draws in moisture on the trade winds that converge and rise forming the intertropical convergence zone.
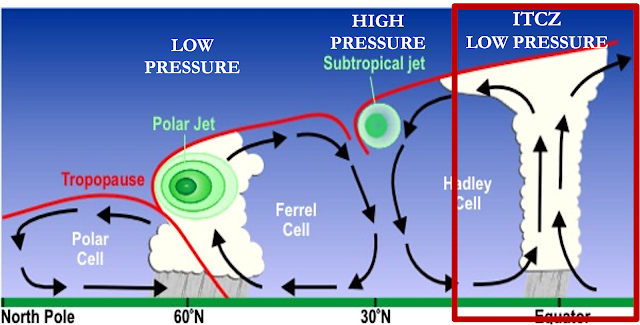
Prevented from rising higher at the tropopause, the winds are now re-directed towards the poles. Those high-altitude winds converge with equator-ward winds forcing air down to the ground.
This creates a quasi-permanent band of high-pressure systems around the globe centered at about 30 degrees.
Upon reaching the ground descending air is now redirected. Some moving back towards the equator and due to the Coriolis effect form the trade winds and complete the circulation cell known as the Hadley cell. See part 2 of this series for a discussion on how the Hadley cell creates the world's rainforests and deserts.
Other wind currents are directed northward and due to the Coriolis effect form the westerly winds.
Where these winds converge with winds from the north pole the air is forced upwards forming regions of low pressure. This dynamic of converging winds forming high- and low-pressure systems can be thought of as a short-wave train
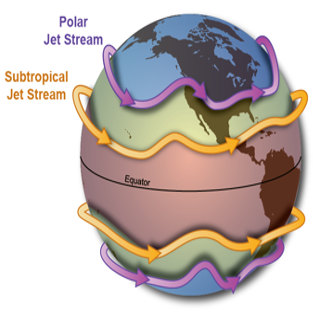
Furthermore, these regions form the major jet streams that modify the location of these pressure systems
In 2003, 2010 & 2018 Europe experienced heat waves that broke many local temperature records. All were triggered by drought and high-pressure systems
According to a peer reviewed paper analyzing the contributing factors Black (2006) also found a regionally intensified ITCZ for the 2003 heatwave.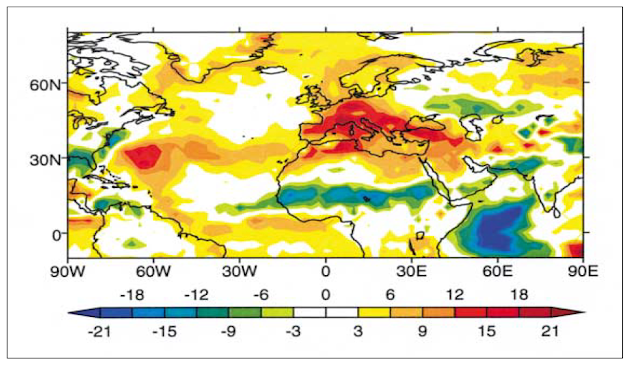
In addition, both Black and Sparnocchia (2006) reported "hot dry air was pumped into western Europe from the Sahara"

El Ninos and La Ninas can shift the location of intense convection of the ITCZ. During a La Nina, intense convection is located over the western pacific warm pool which induces a wave train of sinking air and high pressure over Africa and also over the eastern Pacific, which then induces low-pressure and rain over the Atlantic as seen here.
(I also suggest seeing part 4 discussing how La Nina’s increase the strength of the warm pool causing global warming.)
Intense La Nina convection further triggers a wave train of high- and low-pressure systems that stretches across the Atlantic into Europe and Asia

A map of anomalously wet and dry weather across the globe during a La Nina demonstrates its dominant global teleconnections. It was a La Nina wave train that brought dry weather over the USA’s Great Plains and, with that dryness further amplified by landscape degradation, generated the Dust Bowl and the USA’s period of greatest heat waves.

During an El Nino, the warm water and center of intense convection moves eastward. Sometimes it reaches all the way to the coast of the Americas, and sometimes only to the central Pacific. This induces varying wave trains with a high pressure over Indonesia causing reduced Asian monsoons and drought.
The 1997-98 El Nino brought floods to California and simultaneously extreme drought and a deadly heat wave to Indonesia.

Scientists also determined, since the 1960s El Nino events have amplified heat waves across China
El Nino wave trains also trigger anomalously wet and dry regions around the world but in different regions than La Nina and neutral years.

As Chase (2006) and other scientists have come to realize “natural variability in the form of El Nino & volcanic eruptions is of much greater importance for causing extreme regional temperature anomalies, than a simple upward [warming] trend in time"
The Madden-Julian Oscillation begins with intense convection over the western Indian ocean warm pool that induces descending air and a high pressure further to the east. Then over the course of 60 to 90 days the low- and high-pressure systems move in tandem across the pacific until it reaches the cooler waters upwelled in the eastern pacific

The Madden-Julian Oscillation likewise creates wave trains such as this one causing high-pressure and a heat wave over the coast of South America. The interaction of all these varying wave trains makes for complex weather patterns

Poleward wave trains from El Ninos, La Ninas and the Madden Julian Oscillation will affect the Arctic Oscillation during which the polar jet stream shifts from strong west to east zonal flow in its positive phase, switching to a more wavy flow in its negative phase which disrupts the eastward flow with more northward and southward flows.

Complex interactions with multiple wave trains affects the Arctic Oscillation causing its phases to switch from month to month. Such monthly phase changes are evidence of natural variability that refutes theories arguing the wavy jet stream is driven by less arctic ice and a climate change warming trend.
During February 2021's valentines week, a wavy flow brought cold arctic air southward & deep into the heart of Texas, causing a deep freeze and major societal disruptions.
Just months earlier in June 2020 a very strong zonal flow of the positive phase prevented cold arctic air from moving south, which would normally moderate the summer temperatures around the Arctic Circle.

Accordingly, on June 20th, 2020, Verkhoyansk Russia, just north of the Arctic Circle, reached its all-time maximum temperature record of 38 Celsius, or 100.4 Fahrenheit, to also become the hottest recorded temperature inside the arctic circle
Overland (2020) rightfully concluded this Siberian heat wave and extreme temperature was an example of random weather. But despite contradictory evidence, Overland also dutifully suggested climate change and Arctic Amplification had made the heat wave worse.
Overland ignored that for 30 years prior to this extreme weather event, Verkhoyansk's June temperatures demonstrated a cooling trend.
Furthermore, the previous record high temperature deeper inside the Arctic Circle was just 0.2 degrees Celsius cooler, measuring 37.8 Celsius. or just 0.4 degrees Fahrenheit cooler at 100 F and set in 1915 at Fort Yukon, Alaska.
Just a 0.2 degree increase over one hundred years is, in reality, evidence of an extremely small long-term warming trend due to any Arctic Amplification. And given how sparsely populated it is inside the arctic circle, it is highly likely many other Arctic regions have also experienced similar warm temperatures due to the Arctic Oscillation's jet stream barrier preventing southward flows of cold air; temperatures that were simply not recorded. Nonetheless the UN News, in support of its IPCC’s climate crisis narrative, characterized this weather event as a "disturbing high temperature record". So be scared people!

The North Atlantic Oscillation is the regional expression of the Arctic Oscillation and similarly bounces between a wavy jet stream in its negative phase and a strong west to east zonal wind in its positive phase, and varying from month to month. And again, it is a measure of natural weather variability independent of climate change but causing climate related changes.
As published by Mysak (1990), interactions between El Ninos and the jet stream increased waviness that caused sea ice to expand in Baffin Bay to the west of Greenland where the jet's southward flow brought colder air. Simultaneously it caused sea ice reduction to the east of Greenland caused by the wavy jet's northward flow of warmer air.

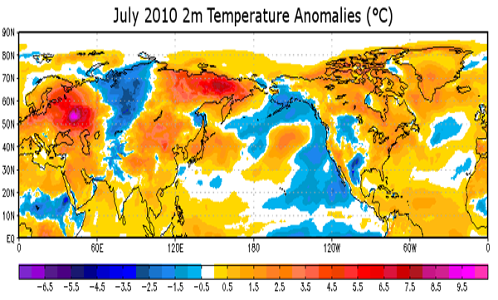
Looking at northern hemisphere temperature anomalies during the Russian 2010 heat wave, we see a quasi-stationary wave train with a hot, dry high-pressure system centered over western Russia causing a month and a half of extremely hot temperatures, a colder low pressure sits over central Russia and a warm high pressure over eastern Russia and cooler temperatures in the north pacific
Randall dole is an expert on blocking high pressure systems and concluded the 2010 Russian heat wave was "mainly due to natural internal atmospheric variability" that causes blocking high pressure systems and heat waves seen in red, to form every few years in the region while dry land surfaces amplified the 2010 heat Hauser (2016) reported "dry soil moisture alone increased the risk of severe heat 6-fold"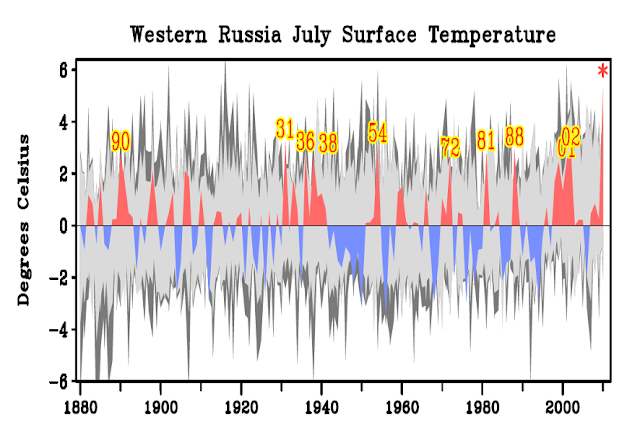
Due to the temperature contrasts between the land and ocean and western USA mountain ranges, the north-east pacific is also a region where a wavy jet and blocking high pressure systems frequently form, bringing drought and heat waves to western north America.
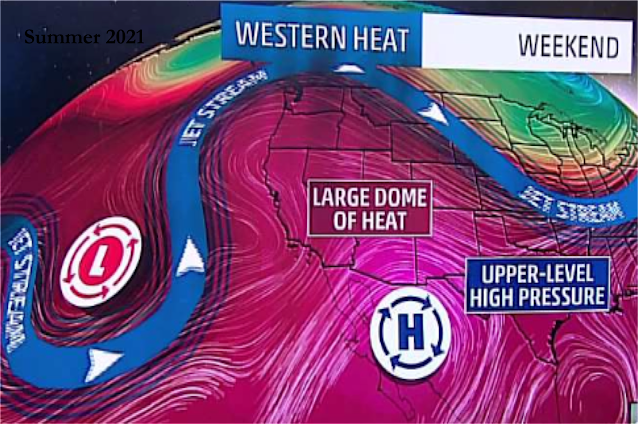
Again, looking at temperature anomalies across north America, we see it is part of a wave train with the hot blocking high pressure system centered over Oregon, Washington and western Canada, a cool low-pressure system sitting over central USA and Canada, warm high pressure over northeast America and cooler temperatures over the north Atlantic
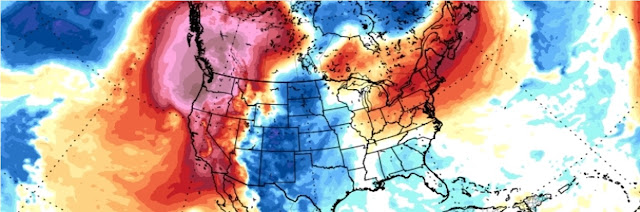
The 45.5 degree Celsius temperature in the town of Lytton British Columbia set a new record for Canada, but just barely as the old Canadian record was 45 degrees flat set in 1937.
And although Oregon saw temperatures exceeding 40 degrees Celsius, it was still cooler than Oregon’s record heat of 48.3 Celsius set in 1898.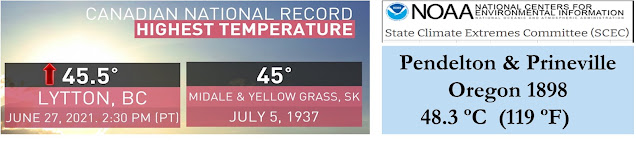
Climate crisis narratives currently bombarding the public consistently ignore a wealth of science in order to focus blame for heat waves on CO2 global warming!
Crisis narratives ignore the hotter extremes in our cooler past.
They ignore the high-pressure systems created by wave train dynamic
Climate crises narratives ignore high pressure system dynamics of
1) clearer skies and increased solar heating
2) drier surfaces that raise the risk of heat waves 6-fold and more
3) adiabatic heating that warms temperatures without any added heat energy
4) and the transport of warmer air into cooler regions
"Attribution science" is a newly created so-called "science" that appears to be just a rubber stamping of the climate crisis narratives as their analyses never fully account for all the contributing factors as good science must, preferring to push a meaningless statistic that a higher average temperature means more extreme weather. It clearly is misinformation
So up next Next: part 6 - How pressure systems control growing and shrinking glaciers
Until then .....