This is the transcript for the video
https://www.youtube.com/watch?v=kQbSplM6o9Y
The Big 5 Natural Causes of Global Warming - part 1: Varying Atlantic Water Transport

I previously discussed how CO2 has maintained today’s hospitable climate in the video titled, “How CO2 Saves The Earth: Greenhouse Gases Vital Warming & Cooling Effects”

But as our lower atmosphere saturates with CO2, additional CO2 has much less of an effect today.
The Big 5 natural climate dynamics - when considered together- offer a far better explanation of both regional climate trends and the statistical global warming trend since the end of the little ice age. The first of the Big 5 identifies the effect of varying transport of warm Atlantic waters into the Arctic.
Jonathan Kahl’s analysis of Arctic surveys between 1950 and 1990 & published in the pre-eminent journal Nature, found no rise in arctic air temperatures.

But after the 1990 shift of the Arctic Oscillation, which caused sub-freezing winds from Siberia to blow insulating arctic sea ice out of the Arctic, arctic air temperatures suddenly began warming several times faster than the global average temperature.
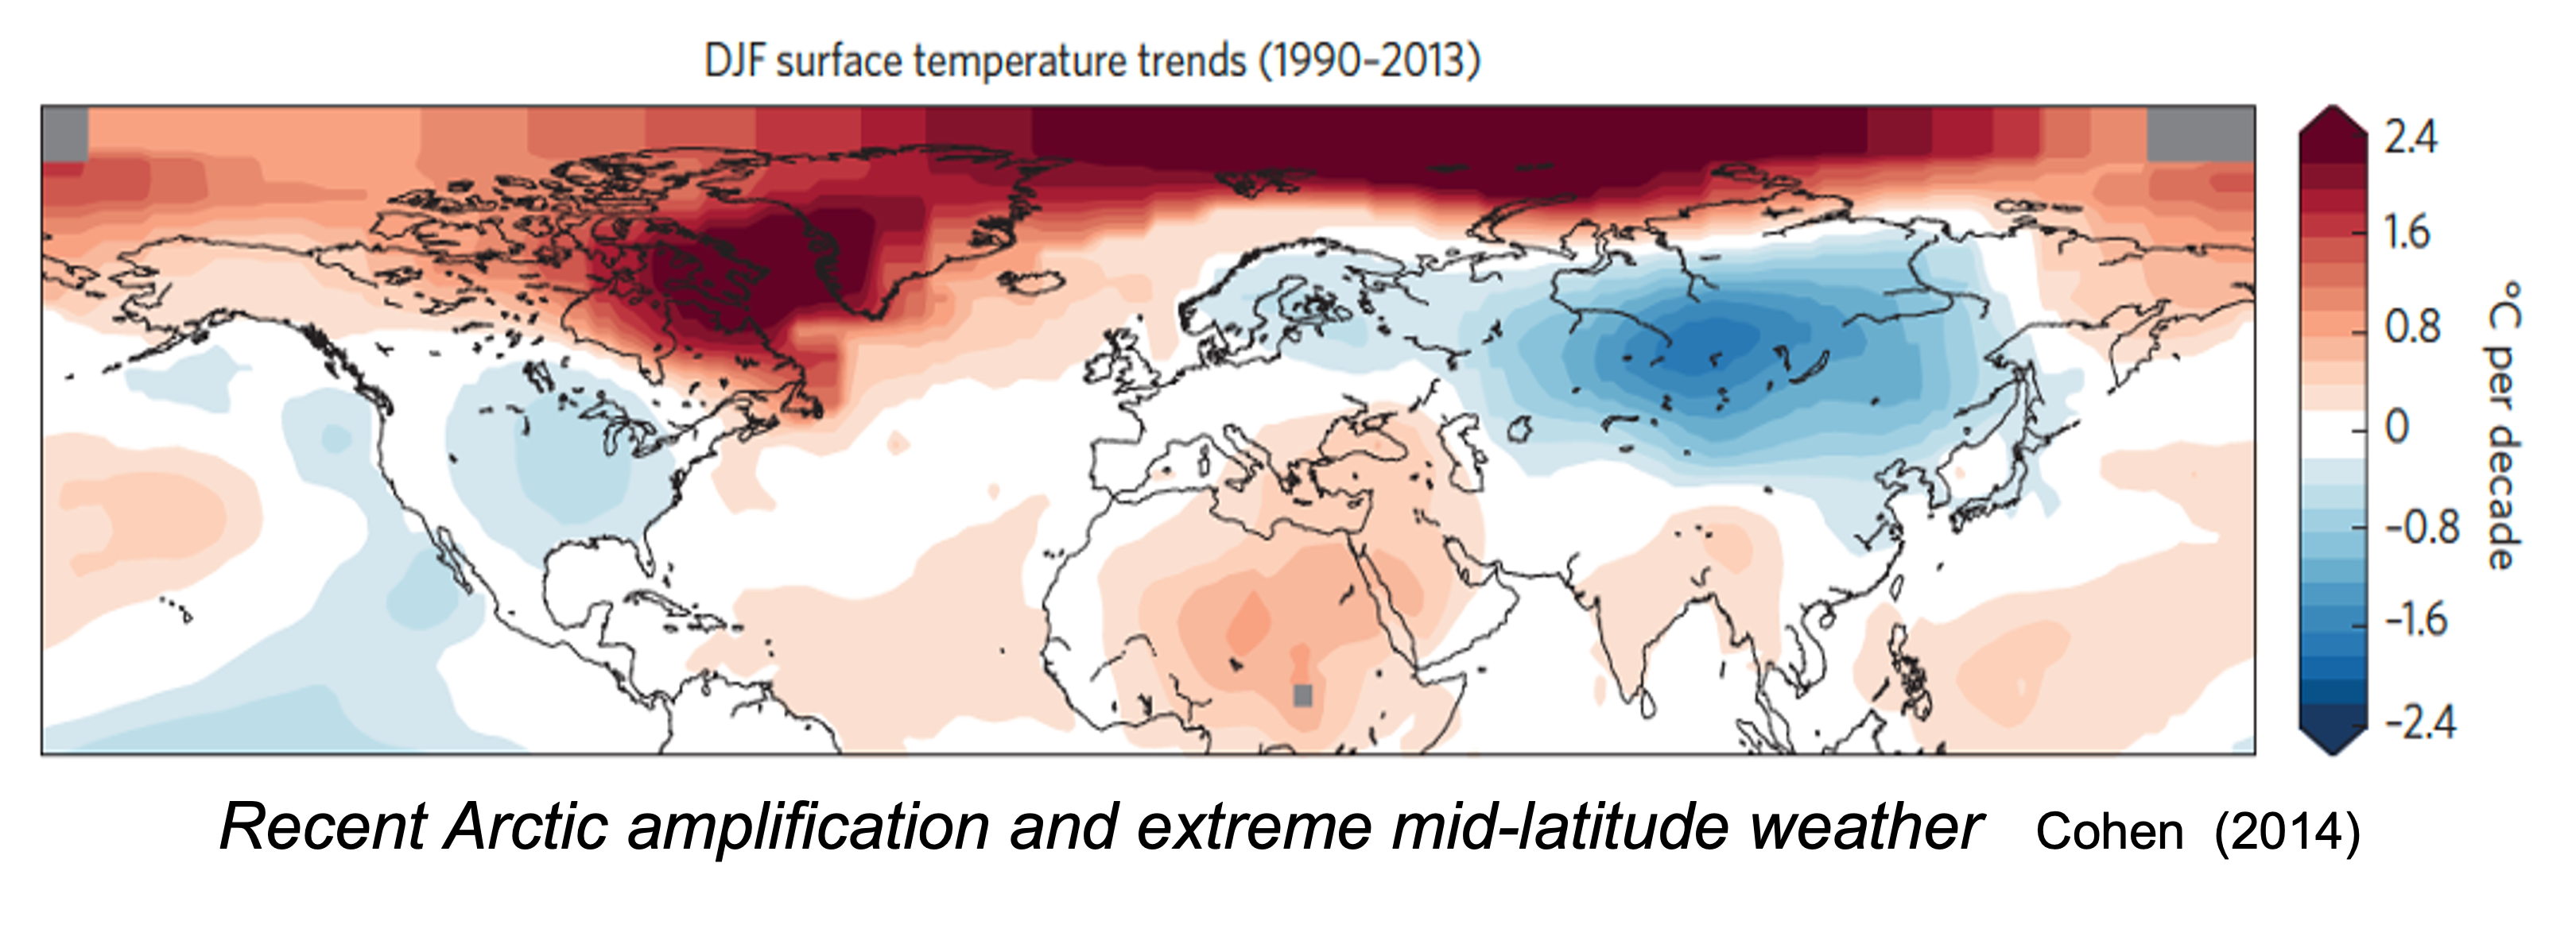
The loss of insulating sea ice increased the ventilation of stored ocean heat, warming the air but cooling the ocean. That warming offset and obscured, the 25-year winter cooling trend in both North America and Eurasia, represented here by the blue colors. Clearly Arctic warming was due regional climate dynamics, not global.
From Danish sea ice records and modern satellite photos, we see two distinct periods with very similar reductions in the extent of arctic sea ice. One during the 1930s and one since 2000. Those 2 periods of reduced sea ice are separated by an intervening 30-year period of increasing sea ice, suggesting sea ice is modulated by a natural oscillation.

The Atlantic Multidecadal Oscillation represents a natural cyclical dynamic where the northern Atlantic waters alternate between becoming warmer than the southern Atlantic and then become cooler.
It cycles approximately every 60 years.


The decades with 0.3 to 0.5 degrees Celsius warmer north Atlantic waters coincide with the decades of reduced Arctic sea ice and rising global temperatures.
The decades between the 1950s to 1990s, when the north Atlantic's temperatures were 0.3 to 0.5 degrees Celsius cooler, Arctic sea ice increased and there was no global warming trend.
As climate scientist Moreno-Chammaro published in 2020, these alternating periods of warmer and cooler north Atlantic temperatures also correlated with changes in the Intertropical Convergence Zone or ITCZ

The ITCZ is a migrating band of rising air, that sailors called the doldrums, which also brings heavy rainfall. Over Asia and Africa the ITCZ follows the sun to the Tropic of Cancer or Tropic of Capricorn according to each hemisphere's summer solstice.
The ITCZ is also the driver of the earth's Hadley Circulation that constantly transports warmth and moisture from the tropics towards the poles.

Where the north and south trade winds converge defines the ITCZ’s position, and determines where the rising branch of moist air of the Hadley Circulation will create a rainy season. Because the OTCZ determines the location of tropical rainy seasons, it leaves strong clues to how its location has changed over centuries and millennia.
Around 30 degrees north and south of the equator, the air moving towards the poles at the top of the atmosphere converges with upper atmospheric winds that are moving back toward the equator. This upper air convergence drives air currents downward to create a quasi-permanent high-pressure region at the surface.
Around 60 degrees north and south, the convergence of opposing surface air currents drives air upwards producing a quasi-permanent low pressure region.
As the ITCZ migrates north and south, so do these inter-connected high and low pressure systems

As illustrated by Zou's 2014 research, during the Little Ice Age as the ITCZ migrated southward, so did its associated pressure systems. Its more southerly location caused warm equatorial currents to be deflected southward by the point of Brazil.
The southward migration of the associated north Atlantic pressure systems also steered warm gulf stream waters more eastward, reducing warm water flows into the Arctic, resulting in cooler temperatures that enabled the greatest Arctic sea ice buildup in 6000 years.
When solar irradiance increased, marking the end of the Little Ice Age, the ITCZ and associated pressure systems all migrated northward.

Now, the more northerly location of the ITCZ guided more warm tropical waters north of the point of Brazil causing more warm water to flow across the equator and feed more warm water into the gulf stream.
Additionally, the northward shifting north Atlantic pressure systems increasingly drove more warm gulf stream waters into the Arctic, which reduced arctic sea ice.
Changes in solar irradiance and sunspot cycles correlate with that migration of the ITCZ. Three sunspot minimums and reduced solar irradiance occurred during the Little Ice Age and correlates with the ITCZ southward migration( illustrated here in blue).
The increasing solar irradiance since the end of the little ice age correlates with the northward migrating ITCZ and our current warming trend.

As the northward migration of the ITCZ resulted in more warm water entering the Arctic, that warm, inflowing Atlantic water circulates around the arctic for 25-30 years at 100 to 900 meter depths.
That warm Atlantic water keeps most of the Barents Sea inside the Arctic Circle free of ice all winter
And warm Atlantic waters circulating along the shallow Eurasian coasts combine with winds from Siberia to push sea ice away from the coast and maintain ice-free polynya during the winter with open waters that further expand during the summer.

The insulating effects of sea ice determines how quickly the arctic ocean will cool and how much heat ventilates and warms the Arctic air.
According to peer-reviewed studies by Ignatius Rigor published in 2002, 3 meter-thick ice can ventilate 5 times more heat (about 10 W/m2) than radiated by society’s added CO2.
Where older ice is replaced by thinner 1-meter thick ice, about 15 times more heat than from CO2 (about 30 W/m2) can ventilate.
And newly forming thin ice can ventilate 350 times more heat than added CO2 (about 700 W/m2)
It is this ventilating Arctic heat that has amplified Arctic and global air temperatures.
As illustrated here by NASA’s National Snow & Ice Data Center,

In summer 1985, over one third of the Arctic ocean was covered by old 3+ meter thick ice (represented here in white) Abundant thick, insulating ice explains why Jonathan Kahl's 1993 analyses found no Arctic warming.
After cold freezing winds began removing that thick ice in 1990, by 2017 less than 5% of the Arctic ocean was covered by old 3+ meter thick ice, and the amount of open water (in dark blue) more than tripled during summer allowing much more stored ocean heat to ventilate
To blame CO2 for the sudden loss of arctic sea ice, which all agreed was caused by the 1990s strong shift in wind direction during a positive phase of the North Atlantic Oscillation, 6 leading advocates of the CO2 warming theory, including NASA’s now chief climate modeler Gavin Schmidt, published in 2002 that rising CO2 was controlling the natural North Atlantic Oscillation,

I quote "four of the five general circulation models show an unambiguously positive Arctic Oscillation and North Atlantic Oscillation response to greenhouse gas forcing, consistent with the hypothesis [their hypothesis] that the observed upward trend in these indices is anthropogenically induced”
But this illustrates how badly Gavin Schmidt's conclusions had been biased by his advocacy, such as his efforts on the so-called RealClimate website that he co-founded with Michael Mann, where he advocated for a hypothetical CO2 driven climate crisis.
In the real world, despite continued rising CO2 concentrations and despite Schmidt's unambiguous modeling results, the North Atlantic Oscillation has been doing the exact opposite. It has been trending more negatively for the past 2 decades.
Oddly, despite this utter modeling failure, Gavin Schmidt was awarded the position of NASA’s GISS director, replacing the prominent climate alarmist James Hansen.

Changes in natural climate dynamics firmly disputes alarmists' claims of a rapidly approaching CO2 driven climate crisis.
1. Increasing arctic temperatures are chiefly caused by ventilating stored heat that warms the air but cools the ocean.
2. The lowest solar irradiance in 100 years (sunpsot cycle 24) suggests further cooling of the North Atlantic.
3. Declining solar irradiance suggests a southward migrating ITCZ causing less northward transport of tropical heat.
4. The coinciding shift of the Atlantic Multidecadal Oscillation further suggests cooler north Atlantic waters entering the Arctic in coming decades, and that would predict that as older Atlantic water circulating in the Arctic for 30 years finally cools, conditions would allow Arctic sea ice to recover.
5. Finally because most climate models and leading climate scientists incorrectly attributed rising CO2 to the North Atlantic Oscillation's shift to its positive phase, their alarmist crisis claims should be viewed with a great amount of skepticism.
So I urge you to consider the effects of natural climate dynamics, and this is just the first of the Big 5 that better explains our current warming trends.
So up next: # 2 of the Big 5 climate dynamics: How shifting jet streams affect global temperatures.


