Translate

Wednesday, July 13, 2022

Attenborough’s “Breaking Boundaries” documentary; Distorting Science to Shill for One World Government


Welcome everyone


Below is thee  transcript for  

Attenborough’s “Breaking Boundaries” documentary; Distorting Science to Shill for One World Government

View at https://youtu.be/w8IbgqVgxP8


Today I will look at how one of my environmental heroes is now betraying the science. When I taught ecological classes, I would eagerly incorporate many of Attenborough’s beautiful wildlife videos.

But after just recently viewing his 2021 video, "Breaking Boundaries: the science of our planet", I’ve been disturbed, to see Attenborough’s magnificent cinematography increasingly used to distort the science, instill fear and shill for “a globalist agenda”

The video alternates between parallel narratives from Attenborough and narratives by a Swedish scientist, Johan Rockstrum. Together they pushed a myth that we are turning a planet that was once our friend, into a planet that is our foe.


But anyone with the least amount of knowledge about earth's history knows the earth has always been both friend and foe to wildlife and humanity. Deadly weather commonly unleashed throughout history, eliminated all that did not adapt, causing mass extinctions and collapsing civilizations.

Oddly, Attenborough argues that by simply adhering to globalist Johan Rockstrum’s planetary boundaries, we can save the world.

And like all demagogues and false prophets, he offers a utopian fantasy that his guidelines ensure the earth remains the "perfect home.”


Attenborough and Rockstrum begin by suggesting that this graph of Greenland’s ice core temperatures is science’s most important and most relevant for guiding human civilization.

Rockstrum points to the great instability of temperatures over the past 100,000 years during the last glacial maximum. The numbered peaks are Dansgaard–Oeschger events, caused when accumulating ocean heat that had been transported from the tropics into the Arctic, periodically melted enough of the insulating ice to let heat ventilate, causing temperatures to rapidly rise by 10 ºC (18 ºF) in just 10 years. That instability, Rockstrum claimed caused great environmental hardships for humans.

But during the most recent 11,7000 years, a period called the Holocene, the average temperature stabilized, and varied only by plus or minus 1 °C. However they don’t mention that stability was due to less ice.

Despite the fact that humans did not create the Holocene, they suggest humans can now magically maintain the Holocene’s stable climate, if only we follow Rockstrum’s guidelines and keep the earth within his so-called 1 ºC planetary boundary.


Attenborough repeats a false narrative that he frequently espouses, bemoaning, "The Holocene has ended. The garden of Eden is no more. We have changed the world so much that scientists say we are in a new geological age: the Anthropocene, the age of humans"

Therefore, to prevent further catastrophes and return to Eden our “immediate priority, is to reduce carbon emissions to zero and stabilize temperatures as low as we possibly can”

In contrast, according to the executive committee of the International Union of Geological Sciences, the official group of scientists who define the earth’s geological ages, the Holocene has not ended. And despite political efforts by some scientists to declare the Anthropocene as an official age in order to highlight humanity's negative impacts, there has yet to be any consensus on the proposal that the Holocene has ended.


Instead of formalizing the Anthropocene, the International Union of Geological Sciences officially defined 3 distinct ages of the Holocene The first 2 ages are defined by dramatic changes in Greenland’s ice core. Accordingly, the Greenlandian Age began 11,700 years ago marking the end of the last glacial maximum, the re-arrangement of ocean and atmospheric circulation and a rapid warming of about 10 degrees Celsius. Furthermore, the transition from the Pleistocene’s last glacial maximum into the Holocene resulted in one of the world’s greatest mass extinctions, mostly of large animals, and the loss of biodiversity.

In contrast to Attenborough’s stable Garden of Eden, Greenland’s ice cores also reveal just how unstable the Holocene climate has truly been.


The Northgrippian Age, named after the location of one ice core, began when temperatures plummeted to the lowest point in the entire Holocene 8,200 years ago. Temperatures then rose, reaching 1 to 2 degrees Celsius warmer than today, that warm period has been informally called the Holocene Climate Optimum. Then a cooling and drying trend occurred that established many of the world's deserts.

The most recent period, the Meghalayan began 4,200 years ago marked by a 200-year global mega-drought that collapsed many Eurasian civilizations, as well as a megadrought in sparsely populated North America, stretching from Massachusetts to Idaho.

Indeed, it has been droughts and famine, during cooling trends that have destabilized the environment and human civilizations.

The Meghalayan’s cooling trend was interrupted by warm spikes lasting several decades such as the Roman and Medieval Warm Periods. In addition, more intense El Nino and La Nina events evolved. Such instability has made it difficult for scientists to determine if recent extreme weather events are just more of the same, or perhaps signal an end of the Holocene and the start of the Anthropocene.


During the Greenlandian Age, the Sahara was a rich grassland with scattered shallow lakes, supporting a wealth of wildlife that supported several tribes of hunters and gatherers. Those stone age people celebrated that abundance of wildlife in numerous cave paintings


But around 6000 years ago as rainfall decreased, the green Sahara transitioned to the Sahara Desert, again greatly reducing biodiversity, and forcing humans to seek more hospitable conditions elsewhere.


The Sahara’s reduced rainfall was largely caused by a shift in the location of the Intertropical Convergence Zone, or ITCZ. The location of the greatest solar heating within the global tropics, causes intense currents of rising air which then draw in moist surface air from the north and south via the Trade Winds, and concentrates that moisture where the winds converge.


As the moist air rises, cools and condenses, that moisture rains out, bringing a heavy rainy season to the land below. The remaining dry air continues to circulate, eventually sinking further to the north and south, bringing deserts and arid climates to those regions below.

The ITCZ moves seasonally with the sun Bringing a rainy season to the tropics north of the equator during June and July, while simultaneously causing a tropical dry season south of the equator.


By December and January, the ITCZ has brought a rainy season south of the equator, leaving a dry season to the north

In addition, the ITCZ also migrates over millennia due to the sun's orbital cycles. Throughout the Holocene, the ITCZ has exhibited a trend that has continuously contracted southward, and it is that migration that reduced the rains that once supported a green Sahara.


In response to the Holocene’s drying trends, humans either perished or moved to the great river valleys where ample water enabled civilizations to continue. Great civilizations emerged in the mid Holocene along China's Yellow River, within India and Pakistan’s Indus River Valley, and along Egypt’s Nile River. Great Stone Age civilizations emerged in Mesopotamia along the Tigris and Euphrates rivers. 


But as the ITCZ continued to migrate, the Akkadian empire in northern Mesopotamia and dependent on rainfall, collapsed during the 200-year drought that marks the beginning of the Holocene’s Meghalayan Age.    Regional rainfall decreased by 20-30% and water levels of the Dead Sea abruptly fell by 100 meters.

The Old Kingdom of Egypt, also known as the Age of Pyramids, also collapsed as drought reduced the Nile River's flow and the floods that had previously renewed the fertile soils and maintained Egypt’s agriculture.


Late Bronze Age civilizations such as those that flourished in Greece, or Troy or had re-emerged in Egypt, collapsed due to megadroughts 3,200 years ago

The greatest droughts and deadliest famines occurred during conditions of low CO2 and cooler temperatures of the Little Ice Age, under the very conditions that Attenborough and Rockstrum argue that we must return to.

The Great El Nino and resulting droughts of the 1790s devastated east India and caused widespread civil unrest. The Victorian Great Drought of 1876 resulted in 30 million deaths The mid–1700s Strange Parallels Drought caused famine and substantial societal upheaval across southeast Asia, India, and the Siberian plains.


Climate change during the Little Ice Age also brought murderous diseases such as the Bubonic Plague, but that was never mentioned by Attenborough. Instead, despite mounting evidence that the Covid pandemic was caused by an escaped virus designed in China's Wuhan laboratory by medical experts whose gain of function research was globally funded, Attenborough featured a cholera expert who fear mongered that the Covid epidemic is evidence of the world exceeding our planetary boundaries.

Yet the Bubonic Plague, the greatest killer of all, that had truly been affected by climate change, was ignored. That plague killed over 200 million people worldwide, even though we were well within Rockstrum’s climate boundary. The Bubonic Plague periodically disappears when temperatures rise above 81.5 ºF (27.5℃), because its transmission is greatly reduced by that warmth. But that fact does not support Attenborough’s CO2 driven global warming climate crisis narrative


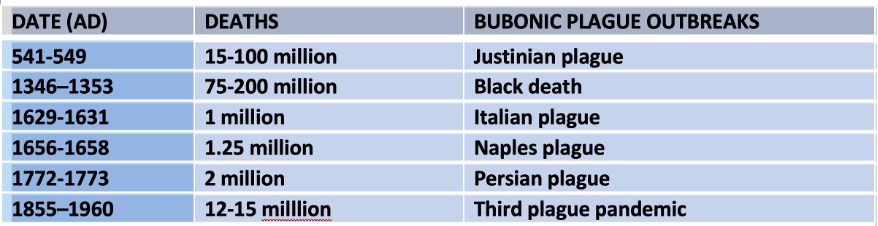
Furthermore, La Ninas drive Asia’s wet periods, increasing vegetation and promoting greater rodent populations. In turn, more rodents support more fleas that transmit the deadly bubonic bacteria. When El Ninos bring dry periods that reduce the Asian rodent population, flea populations are forced to seek other hosts and so bite and infect other animals and people.

By the end of the video the reason for Attenborough’s sins of omission and fear mongering become clear. By Rockstrum’s own words, they reveal their true motive for the video's "end of the world" fear mongering.


They want Rockstrum’s planetary boundaries to be the guide for a global governance that could be enforced by the United Nations Security Council.

The natural causes of climate change, a migrating ITCZ, the El Nino cycles of droughts and famines, or the cool conditions that enabled several Bubonic Plague outbreaks, don’t support their arguments that there is a need for a world government, and so, get ignored.

Like all demagogues and false prophets, Rockstrum combined climate fear with a promised utopia, but only if we follow their mandates. He promises clean air, healthier children, longer life spans, stable markets, stable jobs, and less conflicts. But such pie-in-the-sky promises should make all sane people wonder just how badly his politics have biased his science.

Unsurprisingly, Rockstrum is on the board of directors of the "global challenges foundation" whose founder states, “our intention is to start a debate on the need for an international political system” …"the need for a world government” … “one that can enforce its rules”

Rockstrum is also on the board of the "Eat Foundation" that proudly announces it is working to build consensus for a grand food system transformation. You got to wonder what could go wrong when such experts' control the economy? Well, Venezuela, Ghana, and now Sri Lanka quickly come to mind?


The Holocene’s southward migration of the ITCZ also caused increasing climate instability by promoting greater El Nino and La Nina event
s. Alternating El Nino-like and La Nina-like ocean temperatures in the Pacific cause a natural global see-saw of droughts, floods, and heatwaves, but those events have been falsely portrayed as evidence of co2 driven climate instability.

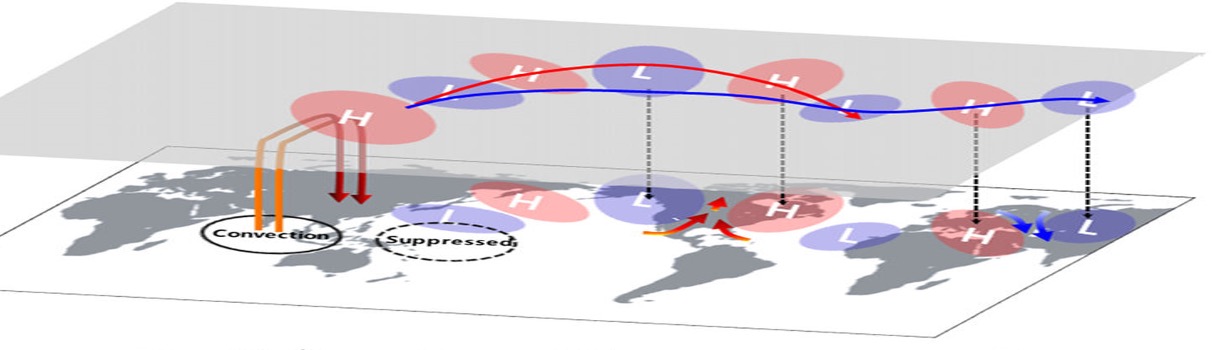
During La Nina-like conditions, strong trade winds cause warm water to pile up in the western Pacific and Indian Ocean warm pools, promoting strong summer monsoon rainfalls that sustain the crops that feed half the world's population. La Nina-like conditions may only last a few years, or for 30 or more years during a negative Pacific Decadal Oscillation, and even longer when strong solar irradiance strengthens the Trade Winds. Simultaneously, La Nina-like conditions force cooler surface temperatures due to upwelling in the eastern Pacific Ocean, which then promotes descending dry air and drought conditions over portions of western North and South America.


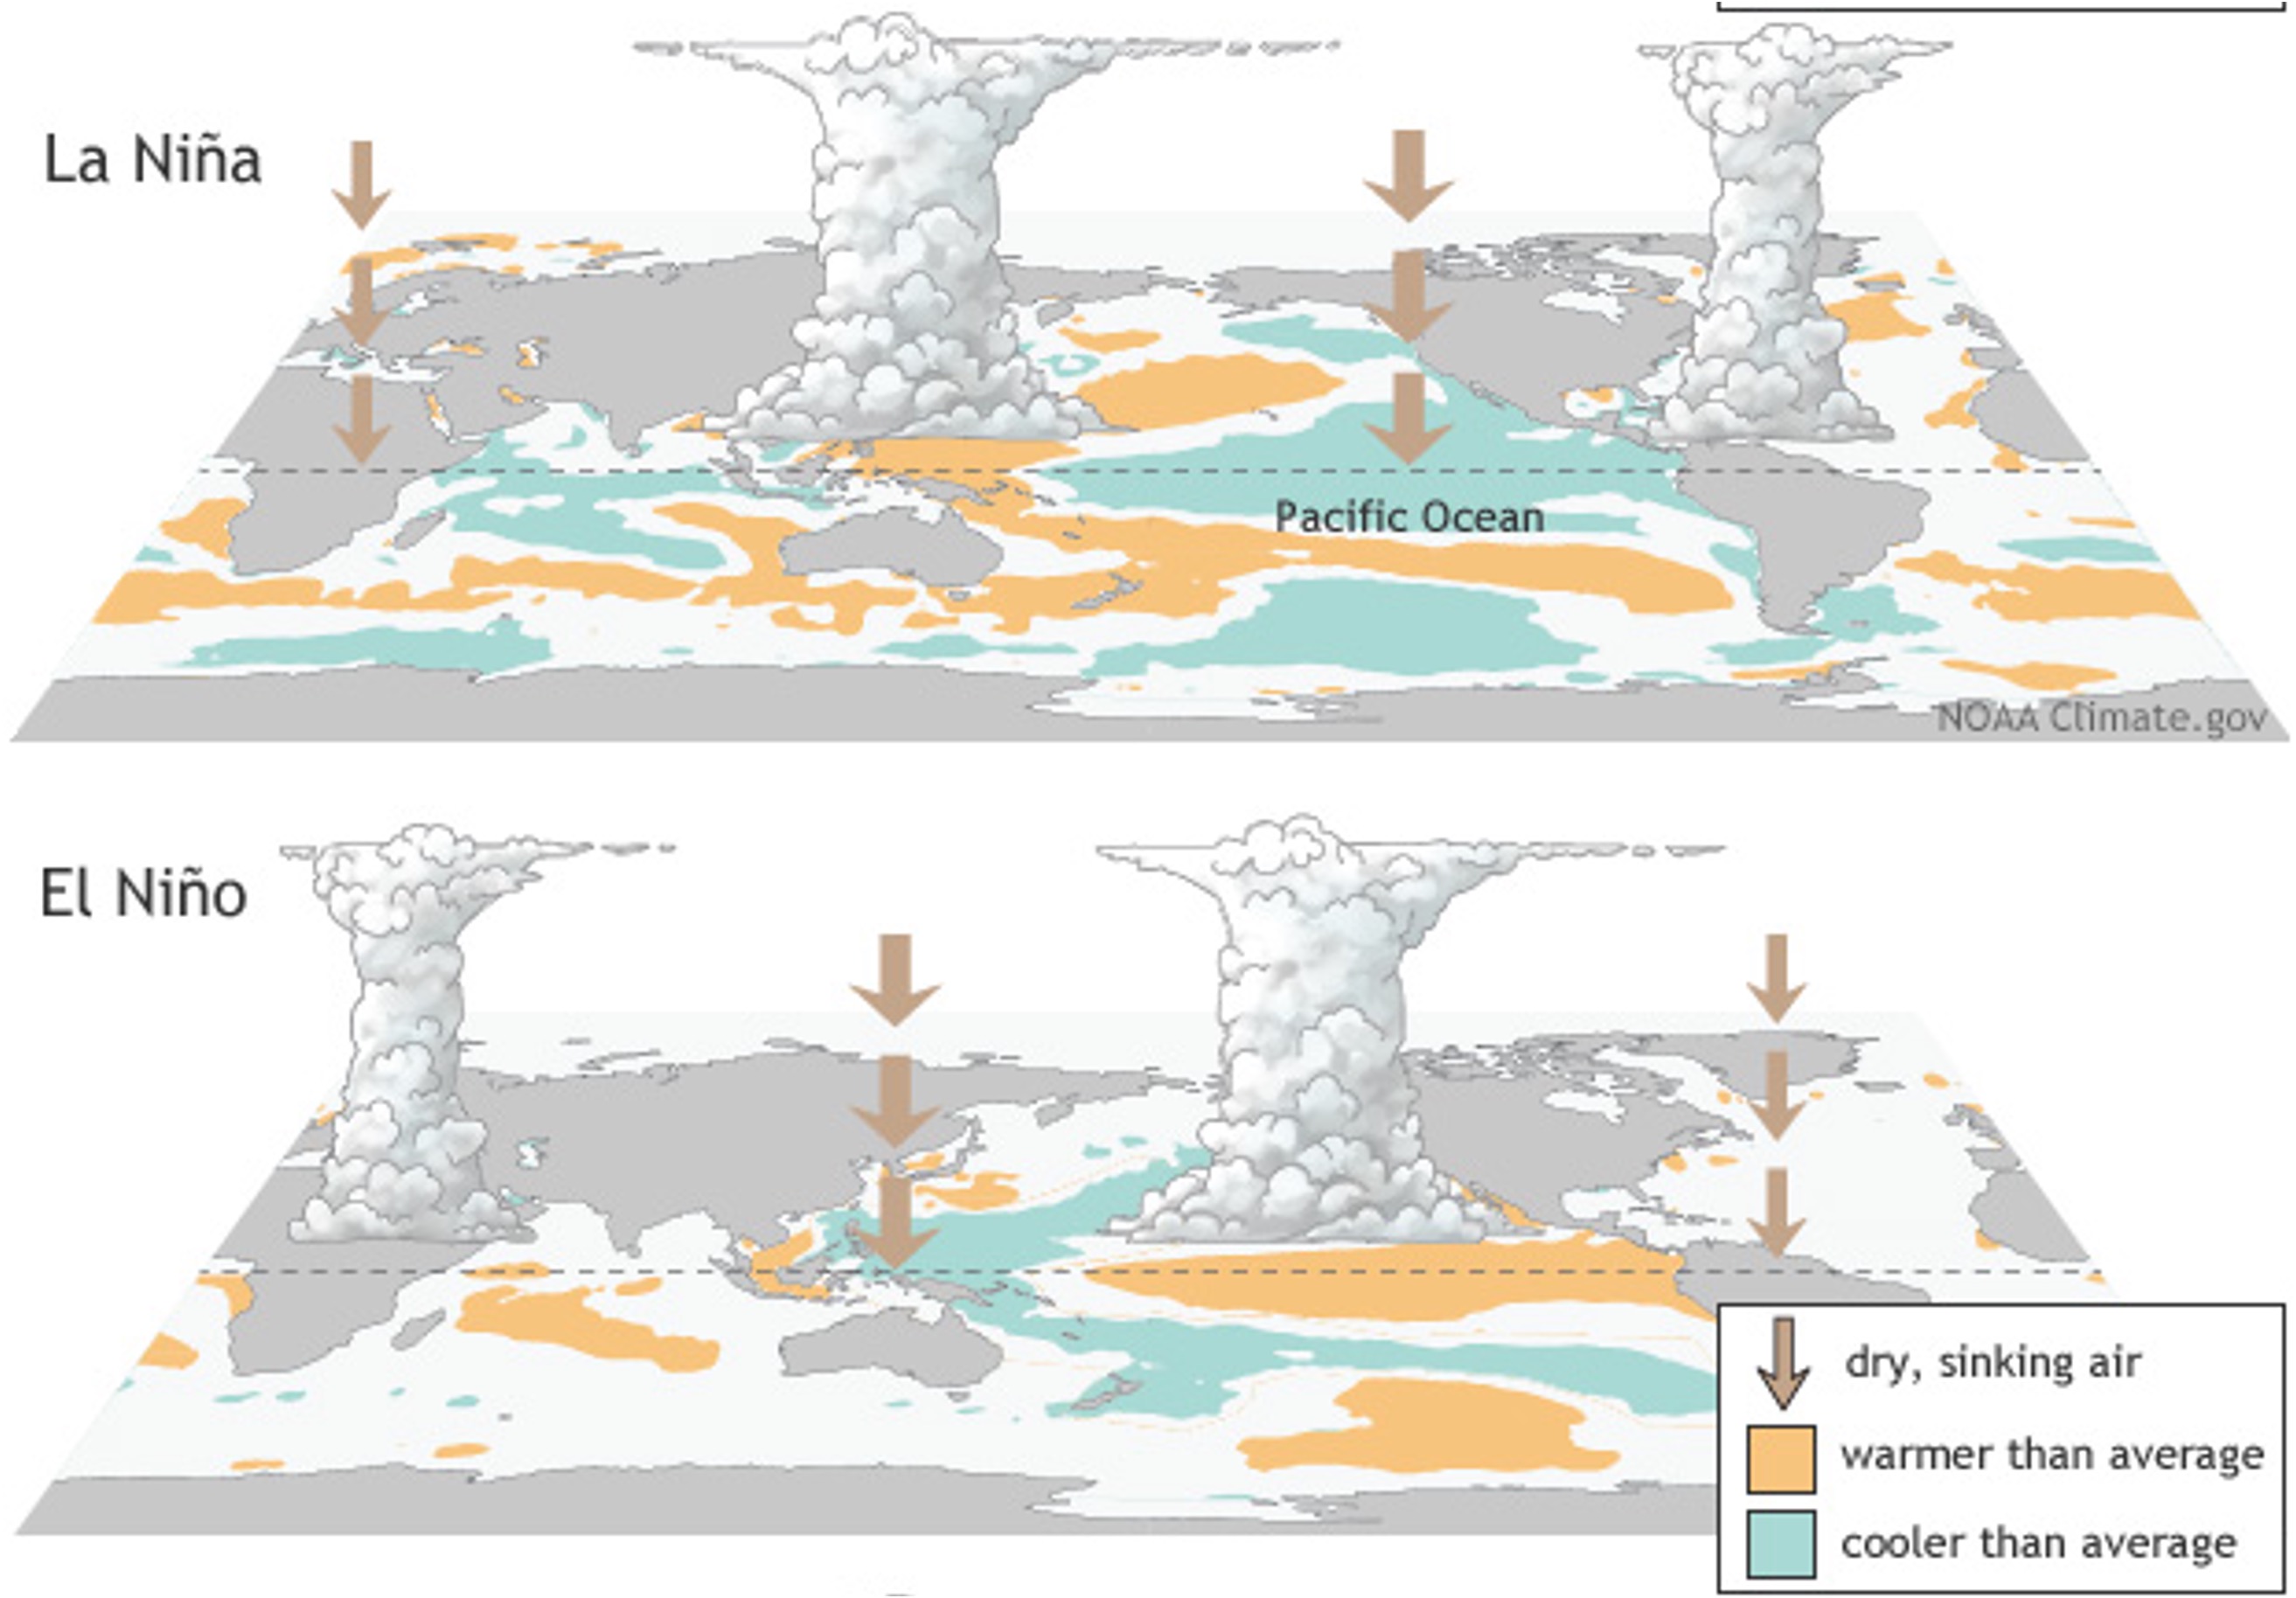
Conversely during El Nino-like conditions, warm water stored in the warm pools, more readily slosh eastward, surfacing somewhere between the central and far eastern pacific, bringing heavy rainfall to the Americas but drought to Asia and Australia. El Nino-like conditions dominate during periods of a positive Pacific Decadal Oscillation or periods of weak solar irradiance as was the case during the Little Ice Age sunspot minimums.

Cooler little ice age temperatures and low CO2 concentrations, never spared the world from massive droughts, famine, or collapsed civilizations and millions of deaths.

.


The El Nino-like conditions that dominated the 1300s and 1400s, brought decades-long droughts that collapsed Cambodia’s Khmer empire, as well as the  Victorian Great Drought and other previously mentioned droughts.

During more La Nina-like conditions during the Medieval Warm Period, extreme drought conditions in the American southwest forced the Anasazi civilization to abandon that region.


To achieve their political aims, demagogues and false prophets always fear monger impending doom. Edmund Burke warned in the 1700s “no passion so effectually robs the mind of all its powers to act, ...and to reason, ...as does fear.”

Tragically, instead of educating the public about the complexities of Holocene climate change and droughts, Attenborough chose to stunt the public's ability to reason by pushing fear. To that end, he included parts of a speech by Greta Thunberg, the teenage actress who first learned to fear climate change at the ripe old age of eight years old.

Although the media has systematically denigrated and silenced knowledgeable skeptical scientists, Greta’s handlers easily featured her so-called in-depth knowledge of climate science at the "World Economic Forum" in 2019 at Davos. 

Her words are repeated in his video, clearly echoing Attenborough’s intent! Greta ranted “I don't want you to be hopeful. I want you to panic, I want you to feel the fear I feel everyday”


Like most mainstream media, every bad weather event becomes a click-bait story about the impending doom of climate change. The NY Times reviewed "Breaking Boundaries", calling it a documentary about the end of the world. Although many outlets criticized the video's animations and presentation style, mainstream media never challenged its abundant distortions and misleading omissions.

Likewise, in the political struggle for power in the USA, the Senate Democrats created the "Special Committee on the Climate Crisis". Their goal was not to uncover the truth by fostering robust scientific debate, but to shut down debate. As their first priority clearly stated, the Committee's purpose was to provide "oversight and investigation of the efforts of special interests to foster climate denial". Gee, how dare our democracy allow citizens to challenge the climate crisis fears pushed by demagogues.


So, it is not surprising that the NY Times just published on July 8, 2022, an article titled “Democrats can win [upcoming elections] if they Embrace the Politics of Fear”. Accordingly, climate fear has been a staple of so many democrat politicians and policies.

Finally, one last example of how Attenborough and Rockstrum distorted the science. Early in the video's narratives they claimed the polar ice caps reflect just the perfect amount of sunlight to prevent the earth from overheating. But now the warming and melting from rising CO2 is disrupting that perfect balance. Yet the history of Greenland’s ice cap tells a very different story.


During the early Greenlandian age, Greenland’s glaciers were still growing. But during the Northgrippian age, glaciers such as the Jakobshavn retreated 100 meters per year and its margin remained behind the glacier's current boundary for 7000 years. Despite reflecting much less sunlight than Attenborough’s perfect balance would suggest, that lack of polar ice never triggered a tipping point or runaway warming. Instead, the earth entered a cooling trend. The recent Meghalayan age had been informally called the neo-glacial as glaciers expanded at higher latitudes with maximum extents culminating in the Little Ice Age.

But due to natural climate oscillations, glacier growth and retreat has oscillated. Between 1960 and 1990, the Jakobshavn did not retreat, and Greenland gained ice.

Similarly, alternating periods of ice growth and retreat, frequently happened between 6500 and 2600 years ago as summer sea surface temperatures alternated between 2–4 °C cooler to 6 °C warmer than present while sea ice ranged between 2 months more ice and 4 months more open water than today. Accordingly, the so-called paleo-Eskimo cultures periodically abandoned and reclaimed the arctic ocean's coastal habitats. So, is the current loss of arctic sea ice simply a continuation of the Holocene’s natural oscillations?

Scientists tell a similar story about Norway’s glaciers that completely melted away at least once during the Holocene. The Hardangerjøkulen glacier, seen here, (and I do apologize to native Norwegian speakers for any mispronunciations) it melted away 8000 years ago when the mean summer temperatures were 1 °C higher than today. 


 The Jostedalsbreen glacier melted away 7600 years ago when mean summer temperatures were 0.7 °C warmer than today.


But most informative, the Folgefonna glacier melted away 9700 years ago when temperatures were similar to today but precipitation, had been reduced by 70%.


Likewise, glacier advances and retreats during the little ice age, in both the Swiss Alps and Africa’s Kilimanjaro, have correlated with changes in precipitation, as evidenced by simultaneous changes in surrounding lake levels. And despite the doomsday narratives, correlations between temperature and ice extent are often lacking. Yet again, Attenborough and Rockstrum ignored those scientific observations so they can push their warming crisis.

Climate truths will always be resisted by those who profit from fear and those who have been naively convinced by chicken little scientists and cinematographers. But the truth will set you free. Indeed, these truths provide the critical thinking to minimize to what degree you will be manipulated by dishonest political agendas. 

So please, share these truths!


Our democracy depends on a diverse array of good critical thinkers. So, please shun mindless group think.

Instead embrace renowned scientist, Thomas Huxley’s advice Skepticism is the highest of duties and blind faith the one unpardonable sin.


Monday, June 27, 2022

Media claims CO2 “traps heat”! A big lie or a big stupid ???

Below  is  the  transcript to the video  

Media claims CO2 “traps heat”!  A big lie or a big stupid ???

view at 

https://www.youtube.com/watch?v=36dAG3YkqSE


Welcome everyone. This video will expose a popular climate myth pushed by the media. Although greenhouse gases warm the earth's average temperature, CO2 does not trap heat.


Click bait media thrives on fearmongering. So, ABC news for example, has published this misleading illustration of solar energy entering the earth's atmosphere, but no energy escaping back to space. To blame rising CO2 on climate change they must call CO2 a heat trapping gas, so they can then make simple minded claims that any rise in CO2 must increase extreme heating and then fearmonger a climate crisis.

But all climate scientists agree that the energy absorbed by CO2 is quickly shed in less than one thousandth of a second. Hardly enough time to argue the heat had been trapped.


Others like climate central who identify as independent scientists and communicators reporting "just the facts about climate change" published this bogus illustration suggesting just half the incoming solar energy is radiated back to space.

But satellite data and energy budgets estimated by climate scientists' have calculated that of the absorbed incoming solar heat, the earth radiates 99.6%, with several tenths of percent uncertainty, back to space as infrared heat waves. The greenhouse effect is more complex because CO2 has both warming and cooling effects.

The only thing getting trapped is the public's misunderstanding of how the greenhouse effect works and their fear of the future.


Several natural climate dynamics trap heat for much longer periods. And those natural climate dynamics are better able to explain observed warming events.

Consider that 99% of our atmosphere is composed of 3 gases, oxygen, nitrogen, and argon, and they are not greenhouse gases. Near the surface, a CO2 molecule collides a billion times every second with non-greenhouse gases, transferring the energy CO2 may have absorbed from infrared heat to those non-greenhouse gases. 


 Conversely oxygen and nitrogen cannot radiate energy away. So, to shed the energy absorbed from collisions with CO2 or the solar heated ground they must collide with greenhouse gases that can radiate that heat away.

If you ever played with newton's cradle, you understand how energy can be transferred back and forth as energy is lost from one ball and given to another.


Alarmist media only focus on the warming effects of CO2 and ignore the fact that increasing CO2 helps infrared radiation escape from the earth's atmosphere by cooling the middle to upper atmosphere


There are three distinct atmospheric layers that affect how infrared heat escapes to space. Changes in the atmosphere's density contributes to how readily infrared heat radiates back to space. At higher altitudes air density is greatly reduced causing fewer collisions and creating wider spaces for infrared to escape unimpeded.


The low-density mesosphere cools with increasing altitude because CO2 radiates more heat back to space, faster than the sun can heat the mesosphere.

The low-density stratosphere also allows more infrared to escape to space, but here the temperature rises with increasing altitude because ultraviolet sunlight interacts with the ozone layer, warming the air faster than CO2 can radiate infrared heat away. However, both observations and modeling have determined that increasing CO2 concentrations are enhancing infrared radiation back to space causing a cooling trend in the stratosphere and mesosphere.

In the dense lower atmosphere, or troposphere, the upwards and downward flow of infrared radiation is approximately balanced, and the warming effect of CO2 is nearly saturated.

Cooling of the troposphere is largely dependent on lower pressure  and rising convection currents that carry warm air towards the stratosphere where more heat can radiate away to space. In the troposphere, the transport of heat via convection is as equally important for cooling as infrared radiation.


When air collides with earth's solar heated surface, it warms, expands, and rises. As the rising air approaches the stratosphere, enough heat radiates away to cool the air and allow it to sink back towards the earth’s surface.

Extreme hot weather typically occurs whenever convection is suppressed. Simply consider the studies that have found stopping convection by rolling up a car's windows traps heat in a car. In just one-hour temperatures inside the car rise by 43 F.


Convection happens whenever a layer of less dense warm air lies below a layer of dense colder air. During the day, solar heating of the ground creates those conditions and promotes convection. But convection can still be suppressed.

The atmosphere must balance regions of rising air with regions of sinking air. So, the earth is covered by a mosaic of regions dominated by rising convection alternating with regions dominated by sinking air that suppresses convection. Regions of suppressed convection can be temporary, causing above average temperatures lasting for just a day, or extend periods of heating for millennia as experienced by the earth's great deserts.


Heat waves are common when the downward flow of air beneath a jet stream's ridge, causes air to rapidly heat as the air compresses. That creates a layer of air that's warmer than the surface air below and that layer serves as the top of a heat dome that suppresses convection. Combined with increased solar heating from clear skies, reduced convection causes heat waves that trap suffocating heat for days and sometimes weeks.

Conversely, convection is suppressed when the surface layer becomes colder than the air above. This typically happens at night and during the winter.


The ground can shed 20 to 30% of its heat to space by quickly emitting infrared wavelengths to space that are not impeded by greenhouse gases. In contrast because the atmosphere’s heated oxygen and nitrogen do not radiate heat at all. The air can only shed its heat more slowly by colliding with a greenhouse gas that can radiate heat away.

This creates the so-called inversion layers with cold air near the surface and a layer of warmer air above that suppresses convection. In contrast to heat domes, this suppressed convection does not cause a heat wave, but it can trap smoke and pollution near the surface.

Asphalt and concrete absorb and store solar heat, emitting it more slowly than normal and raising nighttime temperatures This trapping of surface heat contributes to urban heat islands and explains why city dwellers suffer the most during heat waves


The oceans trap the most heat for the longest times. Massachusetts institute of technology's esteemed oceanographers, doctors Karl Wunsch and Patrick Heimbach, calculated the amount of heat trapped in today's oceans. They estimated that solar heated waters may be trapped for 100 to 10,000 years before that heat can circulated to the surface and escape back to the atmosphere.


The greatest amount of heat is trapped in the Atlantic Ocean, illustrated here by the dark red color. One reason for this concentration of trapped heat is the outflow of warm salty Mediterranean seawater into the Atlantic. The clear summer skies of all Mediterranean climates result in evaporation exceeding precipitation, which causes salty & dense, warm surface waters to sink.

The sinking of dense Mediterranean water creates the warmest waters in the world of any waters at 1000-meter depths.

As detailed in earlier videos, the greatest amount of solar flux into the ocean happens in the eastern pacific during la Nina periods where less cloud cover allows greater solar heating. The trade winds then pile up that solar heated water in the western pacific and Indian ocean, pushing heat down to 200 meters depth and trapping it there for years.


The alarmists' narratives claim the oceans are heating up because oceans absorb 90% of the so-called "excess heat from CO2's downward infrared energy.

But the science suggests it is the sun's visible light that is warming the oceans. Visible light carries far more energy than greenhouse infrared.


And it penetrates to 40 meters depth in murky coastal waters

And up to 200 meters depth in clear open ocean waters

In contrast greenhouse infrared heat penetrates only a few microns past the ocean surface. That heat, absorbed in the ocean's extremely thin skin layer is not transported to deeper layers but commonly and quickly released to the atmosphere via evaporation, suggesting infrared heat from greenhouse gases are not causing ocean warming at all.

Just as trapped solar heat warms the oceans, if outgoing infrared doesn’t balance incoming solar heating the earth's climate will warm. So, the debate becomes: are the currently observed warmer temperatures due to natural dynamics that trap heat as described in the first part of this video, or due to the trapping of heat by rising CO2. But atmospheric physics suggests CO2 can't be more than a minor contributor.


The physics describing how heated bodies emit infrared and how that infrared interacts with greenhouse gases is very well studied and can be accurately modeled as illustrated here in a 2019 paper by atmospheric physicists, Drs. Wijngaarden & Will Happer from Princeton.

The solid blue curve describes a hypothetical condition with no greenhouse gases, and it illustrates how much energy is ideally emitted from a surface with our current average temperature back to space by each infrared wavelength. But keep in mind, without greenhouse gases to re-cycle infrared heat back to the earth's surface to delay cooling, the earth's average temperature would become uninhabitable, plummeting to an average temperature just below freezing.

The jagged black curve indicates how much energy actually escapes via each wavelength under our current atmospheric concentrations of greenhouse gases and ... With CO2 at 400 ppm. The difference between this curve and the idealized blue curve indicates how much of the energy outflow of each infrared wavelength is reduced by greenhouse gases and instead gets re-directed to the earth's surface.

And keep in mind, that re-directed infrared has delayed cooling and raised the earth's average temperature to our very livable current temperature of about 59 degrees Fahrenheit.

Unfortunately, in this and similar graphs, the large areas of reduced outgoing infrared for specific wavelengths, has falsely suggested some of the outgoing energy has been trapped. But that would be a gross misinterpretation.

The large areas of reduced outgoing infrared suggest about 20% could be trapped but that disagrees with evidence from satellite data and energy budgets, indicating at least 99.6% of incoming solar energy, still escapes as infrared. So, if not trapped where does the missing infrared go?

The misinterpretation arises because, when greenhouse gases emit downward heat via a limited number of different wavelengths, the resulting warmed surface then radiates that heat via all possible wavelengths, and that allows more infrared heat to escape via wavelengths of “atmospheric windows" where greenhouse gases do not impede the heat's escape to space.

However, the large reduction of outgoing infrared wave lengths centered around 15 microns, which are wave lengths CO2 and water vapor absorb, indicates CO2 is involved in the greatest intensity of re-directed downward infrared heat.

The area below the green curve indicates how much energy is affected by just CO2, with the remaining reduction above caused by water vapor.

The red curve shows that despite a doubling of CO2 concentrations to 800 ppm, the downward flow of infrared at these wavelengths is only increased by 1%

Water vapor is the major greenhouse gas and absorbs and re-directs infrared heat from a much larger range of wave lengths.

But again, for every wavelength of re-directed downward heat, that heat is not trapped, a significant portion of that heat always escapes unimpeded through the infrared "atmospheric windows". And the longer the nights, the greater the escape of greenhouse heat.


Wijngaarden and Happer also modeled how changes in solar heating due to latitude, affected escaping infrared. Surface temperatures common to the Mediterranean would ideally emit infrared with a maximum intensity of about 140 units And.... Freely escaping infrared through atmospheric windows would range between 110 and 50 units

Over much hotter surface temperatures as observed in the Sahara, ideally emitted infrared increases to a maximum intensity of about 190 units Accordingly in the Sahara, the more freely escaping infrared via the atmospheric windows also increases to a range between 160 and 100 units


Thus, atmospheric windows enable negative feedback that reduces overheating. whether the surface temperatures are raised by increased solar energy or by recycled greenhouse infrared, higher temperatures cause more infrared to freely escape unimpeded through those atmospheric windows.

Wijngaarden and Happer also confirmed what other researchers had found. There is no greenhouse warming over Antarctica in the winter.

The wavelengths dominated by CO2 emit more infrared back to space than Antarctica’s cold surface could ideally emit. This surprising result happens because the heat trapped by non-greenhouse molecules comprising the warm air that is constantly transported southward to the Antarctic, continues to collide with CO2 which can then radiate heat out to space.


Unusual warm events in Antarctica that the media ignorantly proclaims to be caused by CO2 warming, are caused when warm winds originating from elsewhere descend to Antarctica’s surface, as observed during its many fohn storm events

So, beware of anyone telling you that increasing CO2 is increasingly trapping heat and causing a climate crisis. They are either ignorant of the science, or dishonestly manipulating your thinking to advance their political agendas.


Truly .... there is no climate crisis

Our democracy depends on a diverse array of good critical thinkers. So, please shun mindless group think. Instead embrace renowned scientist, Thomas Huxley’s advice

Skepticism is the highest of duties and blind faith the one unpardonable sin.

Tuesday, June 7, 2022

Big 5 Natural Causes of Climate Change part 5: Clouds the Moderators of Warming and Extreme Heat


Below is  the transcript from the video 


Welcome everyone to the final part of the Big 5 Natural Causes of Climate Change - here I examine the impacts of changing cloud cover.

On balance, clouds cool our climate

Conversely, fewer clouds will produce global warming, as well as extreme local heat waves.

As climate scientist Kevin Trenberth explained in 2009, “Global warming is mainly caused from increases in absorbed solar radiation due to decreasing cloud cover.”

Most climate scientists admit, the great difficulties in estimating cloud effects have caused significant uncertainty regards global warming calculations.


Because the amount of water vapor in the atmosphere rapidly declines with altitude, High clouds are usually thin and reflect a minimum of sunlight, but still have a greenhouse effect. Whereas low clouds are denser and will significantly reduce the solar radiation absorbed at the earth's surface

According to calculations in wild 2019, on average clouds reduce about 54 watts per meter squared of the sun's energy

One quick side note here: Non-scientists are often put-off by the unfamiliar measurement used by all climate scientists of watts per meter squared. But it is just a measure of energy flowing each second into and out of the earth. For our purposes, all one needs to understand is the greater the number of watts, the greater the energy flow.

To determine if humans are disrupting the earth's energy balance, scientists construct energy budgets as illustrated here. But the amount of information is so dense, it readily confuses the general public. To help clarify, I’ll guide you through the important points.

It is also important to pay attention to the plus or minus numbers that reflect how uncertain each calculation is.


For example, here they calculate that the earth's surface absorbs just 6 tenths of a watt more than it emits back to space with that imbalance causing the earth to warm. But being good scientists, Stephens (2012) also published that their calculations could be 17 watts too high or 17 watts too low, reflecting just how unsettled the science is. So, beware of the scientists' illustrations that do not accurately publish their uncertainty.

Some estimates are very accurate. Satellite measurements of solar radiation have very little uncertainty. After averaging for day and night, and differences between the equator and the poles, energy budgets begin with an average solar input of 340 watts per meter squared at the top of our atmosphere.

After subtracting estimates of the energy absorbed by the atmosphere and reflected by clouds or the earth's surface, they estimate each square meter of the earth's surface absorbs on average between 159 and 165 watts.

What confuses most people is why isn't the earth cooling if the surface absorbs about 160 watts of solar energy, but then releases more than twice that energy away as infrared?

The confusion arises due to the greenhouse effect. Primarily water vapor and clouds, plus carbon dioxide and other minor greenhouse gases readily absorb most infrared energy. But in less than a microsecond, greenhouse gases immediately lose that energy either via a collision with O2 and N2, or emit that energy, with half that energy being directed back towards the surface and recycled. The recycling of infrared energy is called greenhouse warming, but it would be more accurately called delayed cooling. The more energy that is recycled the slower the surface cools.

Click-bait mainstream media and politicians greatly mislead the public when suggesting CO2 traps heat energy. Each time heat energy is recycled back towards the surface, the earth quickly emits 10% to 30% of that energy as infrared energy in wavelengths that greenhouse gases cannot absorb. So, with every recycling of downward infrared energy, 10 to 30% leaks back to space uninhibited and it exits at nearly the speed of light.

Clouds increase the amount of greenhouse heat that gets recycled, and according to wild 2019, on average clouds re-direct 28 watts per meter squared back to the surface.

However, because clouds reflect away twice as much solar energy as they recycle, on balance, clouds cool the earth by 26 watts per meter squared.

Eventually it is estimated that 239.7 watts per squared, and an uncertain plus or minus 3.3 watts, escape to space. The claim that CO2 is causing a warming crisis by creating a heating energy imbalance of 0.6 watts per meter squared is questionable simply due a level of uncertainty that is 5 times greater than their claim

Furthermore, when compared to the IPCC’s estimated 2.5 watts of added greenhouse gas warming, reduced cloud cover can also amplify solar heating. A cloudless sky can have 10 times the heating effect of CO2.


The earth’s atmospheric circulation causes both moist regions with dense cooling clouds and hotter drier regions with clear skies. The primary driver of atmospheric circulation is the Hadley Circulation. The intertropical convergence zone or ITCZ is a region near the equator where the north and south trade winds converge, driving moist air upwards and generating towering cumulonimbus rain clouds.

Thus, the ITCZ covers a region of heavy precipitation which sustains the earth's equatorial rainforests.


What goes up must come down. After the moisture rains out, the air is dry and sinks to the north and south of the ITCZ. The sinking dry air prevents cloud formation, minimizes rainfall, and increases extreme solar heating, characteristic of the world's deserts.

When incoming solar energy is averaged across the globe, it obscures critical local dynamics caused by clouds. Whereas the global average of surface solar heating is about 160 watts per meter squared, at midday under clear tropical skies, the surface can receive 1000 watts. Under the clearer skies at the edge of the Sahara Desert, Aswan, Egypt constantly receives 160% of the averaged solar heating (or 263 watts per meter squared)


Cloudless desert skies also cause extreme weather swings. According to NASA, deserts experience the most extreme annual maximum temperatures, averaging 38 Celsius or over 100 degrees Fahrenheit. With fewer clouds, surface heat more rapidly cools at night as less infrared heat is recycled. And temperatures can drop by 75 degrees Fahrenheit falling below freezing.

In 1913, Death Valley reported the world's record high daily temperature of 56.7 Celsius or 134 Fahrenheit. Just 6 months earlier, similar dry cloud free conditions produced Death Valley’s coldest minimum temperature of minus 9 degrees Celsius or 15 Fahrenheit.

On smaller scales, heat domes form wherever descending air currents prevent convection and reduce cloud cover, causing extreme solar heating,


Jet stream troughs promote rising convection, more clouds, and cooler temperatures. Jet stream ridges cause dry descending air, less cloudy skies, and high temperatures

The cloudless skies beneath a stalled jet stream ridge caused the stifling heat dome over northwestern north America in 2021. As detailed in part 2, that heat dome generated Canada’s record high temperatures of 49.6 Celsius or 121.3 Fahrenheit.

On a global scale several studies have reported cloud cover has been decreasing since at least 1980, with the advent of satellite coverage. A 2014 study determined there was a 6.8% decrease in cloud cover over the northern hemisphere which increased solar heating by 5.4 watts. That declining cloud effect adds twice as much solar energy than what the IPCC attributes to rising greenhouse gases, and over 3 times the heating attributed to rising CO2.


A 2022 paper reported a similar decrease in cloud cover, noticing the rise in global temperatures correlated with decreasing cloud cover. Thus, researchers also argued cloud cover has a greater radiative effect on global warming than rising CO2.


However, different types of clouds have different causes and very different heating and cooling effects, so more detailed analyses beyond total cloud cover are needed to correctly assess the effects of changing cloud cover. Low level clouds below 2000 meters, significantly reduce solar heating and minimally add to any greenhouse warming.


Stratus clouds form in flat layers when moist air sits over cooler surfaces causing, water vapor to condense into liquid drops. Moist air traveling over regions of cold ocean upwelling produces low stratus clouds, also known as fog. Also, when a warm air mass gradually moves over a cold air mass stratus clouds form.

In contrast, the lumpier tops of cumulus clouds form when heated surfaces cause several currents of rising moist air that condense at higher altitudes.

If there is an abundant supply of moisture, such as over tropical oceans, the latent heat released from condensing moisture powers the rising momentum that grows a low-level cumulus cloud into a towering cumulonimbus that rises to the stratosphere. Because the stratosphere is warmer than the rising air, these cumulonimbus clouds flatten out at the stratosphere boundary causing the characteristic flat anvil top.

High altitude cirrus clouds are thinner and don't reflect much solar heat but do have a small greenhouse effect causing net warming. Cirrus clouds are often produced by the outflow from the anvil top of cumulonimbus clouds. Because cirrus clouds are composed of ice crystals and slow to evaporate, cirrus are often transported far from their point of origin.

Observing the narrowing of the ITCZ during the decades of recent warming and the resulting reduction of cirrus cloud production, MIT’s Dr. Lindzen postulated the "iris effect", a negative feedback mechanism promoting climate balance by reducing cirrus caused greenhouse warming.

Adding to the complexities of cloud science is the diversity of cloud life cycles, with most individual clouds growing and dissipating in less than one hour. Their varied lifetimes are being better determined by geo-stationary satellites. The Madden Julian Oscillation, first discovered in 1971, is a natural climate dynamic causing growing and dying clouds to move across the tropical ocean at speeds between 14 to 19 kilometers an hour, creating alternating regions of heavy rains and marine heat waves.


Heated waters of the Indian ocean warm pool initiate rising convection that gives birth to a cumulonimbus cloud. As the cloud grows, it reduces the amount of infrared heat that escapes to space. However, it also increasingly blocks solar heating, and on balance causes the ocean surface to cool which initiates the clouds decay.

After the moisture rained out of the rising air in the growing cloud, the remaining dry air descends further to the east suppressing convection The cloudless skies beneath the descending air causes intense solar heating of the ocean surface. According to Wirasatriya (2017) 60% of the equatorial hot events with sea surface temperatures exceeding 30 degrees Celsius for 6 to 30 days, are associated with this phase of the MJO Eventually surface heating initiates a new region of convection and new cumulus cloud formation

The intense convection of the Madden Julian oscillation also initiates other wave trains of rising and sinking air that stretches across the hemisphere. The wave train's high-pressure areas can create heatwaves as far away as the Atlantic.


The greatest amount of solar heat flux into the ocean happens along the equatorial Pacific, and that heat then gets transported across the globe and to warms the earth. The cloudless areas of intense solar heating during the Madden Julian Oscillation's hot events contribute to the increased heat flux into the western and central Pacific. But due to upwelling of colder waters in the eastern Pacific, the Madden Julian oscillation doesn’t reach that region.


As detailed in part 3 of this series, it is the clearer skies in the eastern Pacific associated with La Nina like ocean conditions that enables the greatest amount of heat flux into the eastern Pacific.

Not only do La Nina like conditions in the Pacific increase ocean heating, La Ninas and the related negative Pacific Decadal Oscillation, expand the Hadley circulation’s region of reduced clouds and increased solar heating


And same as the Madden Julian Oscillation, La Nina's center of intense convection in the western Pacific, initiates hemispheric wave trains and alternating regions of high and low pressure. The descending air under one high pressure region resulted in clear skies, increased solar heating and calm winds that reduce evaporative cooling, and produced a notorious long-lived heat wave in the north-eastern Pacific dubbed "The Blob"


Every 3 to 7 years an El Nino causes an eastward flow of warm water, that increases cloudiness and reduces heat flux into the eastern Pacific. The first extreme El Nino of the 21st century happened in 2015 and 2016

That El Nino shifted the center of intense convection eastward, which also produces different wave train pathways. Accordingly, the 2016 El Nino's new wave train ended the hot Blob's existence.


Coral reefs of Fiji, Tonga & Rarotonga have recorded 150 years of ocean warming and are sensitive to temperature changes caused by the Pacific Decadal Oscillation.

La Nina-like conditions during each negative Pacific Decadal Oscillation (PDO) phase reduce clouds in the eastern Pacific. Accordingly, during each negative Pacific Decadal Oscillation phase, ocean heat content has increased


El Nino-like conditions dominate during each positive PDO phase, generating a cloudier eastern Pacific & reduced ocean heating

Several studies have reported that the Hadley circulation is widening, Especially during La Ninas and negative Pacific Decadal Oscillations As the regions of descending air currents and reduced-cloud cover expand poleward, heat flux into the Pacific increases.

Both observational and modeling studies find That as the world warmed the Hadley circulation intensified and the ITCZ narrowed. As illustrated by Su (2017) the narrowing of the ITCZ causes the region of cumulonimbus clouds to narrow but extend further upwards (the darker blue cloud), while reducing the cirrus clouds that before had extended away from the anvil tops (the gray cloud outlines). That dynamic is similar to Lindzen's “Iris Effect” that would reduce cirrus greenhouse warming.


But there would also be a greater warming effect caused by the reduction in low level subtropical clouds that allows greater solar heating. As Shin 2012 and others have reported, the Hadley Circulation's intensification widens the regions of descending air currents, reducing cloud cover and expanding the dry lands as illustrated by the change from larger low level clouds areas before (colored gray) evolving into smaller low level cloud cover (illustrated in darker blue).

The regions with the greatest reduction in global cloud cover occur where heat flux into the oceans is greatest.

So, to whatever degree the cause of global warming, whether the Big 5 Natural Causes or added CO2, the resulting reduction in low level tropical cloud cover would serve as positive feedback amplifying any warming.

The Big 5 Natural Causes of climate change together, do explain most of the 150 years of global warming.


When the causes of natural climate change are fully accounted for, as good rigorous science traditionally demands, it constrains to what degree warming effects can be attributed to rising CO2.. Constrained by natural climate change, CO2 can only contribute much smaller amounts of heat than what's repeated by the narratives of alarmists seeking to control energy policies. Clearly when you follow all the science, there is no climate crisis

Up next: Well, I’m taking a 2-week vacation will determine the topic of my next video when I return. But I encourage you to send me suggestions for topics that you feel are needed to further clarify climate science

Until then, heed renowned scientist Thomas Huxley’s advice, skepticism is the highest of duties and blind faith the one unpardonable sin.

And if you appreciate the science clearly presented here, and rarely presented in mainstream media then please, give it a like, give it a share or copy the URL and email it to friends, subscribe to my channel to find all my videos or read my book Landscapes and Cycles: an Environmentalist's Journey to Climate Skepticism.

Thank you