Translate

Wednesday, September 7, 2022

ARE PAKISTAN’S FLOODS YOUR FAULT AND YOU SHOULD PAY?


ARE PAKISTAN’S FLOODS YOUR FAULT AND YOU SHOULD PAY?

below is the transcript to the video at https://youtu.be/uMBY1-ceo6Y

Today I want to separate the science of Pakistan’s devastating floods from the shamefully manipulative narratives by politicians and the media.

The worst is MSNBC’s attempt at public shaming by calling the catastrophe "climate racism”.


Pakistan’s government is in dire need of world bank bailouts due to past corruption and ineptitude. So it is not surprising that Foreign Minister Zardari blames a climate crisis and scape goats industrialized countries, stating “the citizens of Pakistan, are paying the price in their lives, their livelihoods for the industrialization of rich countries that has resulted in this climate change"

In contrast, honest scientists have stated what has been known for centuries, and I quote "the rivers of the Himalaya are susceptible to extreme floods on many timescales and future floods can be expected with or without significant human-induced climate change.”


First consider that Pakistanis have blamed their own government for many of their problems.

Critical of flood control policies, the adviser to chief minister of Baluchistan, Kaisar Bengali, reported: “dams create floods, dams don’t prevent floods…in 2010 the water that passed through the Indus was less than in 1976. Yet, it created more flooding because the river had risen 6-7 feet” due to the accumulation of sediments behind the dams.

Many accuse that flood control projects have favored wealthy landowners who benefit from developing certain floodplains while diverting waters to the floodplains inhabited by the nation’s poorest.

Environmental sciences professor Shafiqur Rehman said, “first we build dykes and spend millions of rupees on them & then we blow them up and drown people to save cities or other areas,”


And of course, there are widespread complaints about government corruption. Hashim Nisar Hashmi, at Pakistan’s university of engineering and technology said, “if maintenance of flood embankments had been adequately maintained by provinces, major losses would have been averted”

Now consider that Pakistan’s unique location has made it vulnerable to natural swings of dramatic weather between major droughts and major floods long before rising CO2 has had any impact. Since 1850 Pakistan has experienced 7 major droughts and 6 major floods. And it is common local knowledge that summer monsoons always cause flooding in some rivers somewhere in Pakistan.


The 2010 floods have been extremely well studied and those studies provide guidance in understanding the very similar 2022 floods.

As Khandekar (2010) published, “a rapid transition from El Niño to La Niña between spring and summer of 2010 appears to be the key element in triggering a vigorous monsoon of 2010 over the Indian subcontinent.”

Khandekar concluded, “the 2010 Pakistan floods, although seemingly unprecedented, were well within natural variability of the monsoonal climate over the Indian subcontinent. I have suggested before, there is an urgent need for an improved understanding of the many complex features associated with the Indian/Asian monsoon system”

So, to that end, this video intends to provide the public with an introduction to those complex dynamics driving Pakistan’s monsoon floods and droughts. The following information will provide the public with facts and a few critical thinking tools needed to decide if Pakistan’s floods were the result of your carbon-rich lifestyles, or just natural events long endured in Pakistan.


Indeed, natural La Nina / El Nino cycles have been demonstrated to contribute about 50% of monsoon variability.

During La Nina-like conditions the Bay of Bengal experiences heightened convection, and thus contributes greater quantities of water vapor to the region.

During El Nino conditions the center of convection migrates to the eastern pacific, thus reducing the water vapor that can be transported over India and Pakistan.

Additionally, the negative phase of the Pacific Decadal Oscillation makes La Nina-like conditions more frequent for 20 to 30 years, as has been the case since 1999.

So, consider that Pakistan’s heavy flooding in both 2010 and in 2022 happened during La Nina years.


Also consider that, since 1880 there is no trend in excess rainfall or drought conditions over the greater Indian region. There has been no unusual increase in recent decades in expected excessive rains either from la Nina or due to rising CO2.

So how does science explain recent floods?

Climate alarmists always frame every weather event in terms of warming from added CO2. Alarmists throw out a simple factoid that warmer air holds more water vapor. Thus, it should follow that increased rainfall must be due to rising CO2 warming. But that dynamic is often totally irrelevant for most weather catastrophes. Just consider that the warmest deserts hold the least water vapor.

In contrast most scientists understand there are many other factors affecting these complex weather events. Honest scientists will tell you that “increases in atmospheric water vapor content alone cannot explain changes in intense rain events due to rainfall's strong dependence on vertical motions”


So first consider that the Intertropical Convergence Zone, or ITCZ, marks where moisture laden trade winds concentrate their water vapor while their convergence forces that air to rise, where it then cools, condenses, and precipitates.

Due to that dynamic, the world's narrow ITCZ band accounts for 32% of all global precipitation.

When the ITCZ follows the sun's seasonal path northward. It brings the wet season to India and Pakistan.

When the ITCZ retreats southward in the winter, they experience their dry season.


Research has also demonstrated that due to changes in the earth's orbit and axis tilt, the earth has been steadily cooling for the past 8 thousand years and accordingly the ITCZ’s northern limits have progressively moved towards the equator.

During the Holocene Optimum when the ITCZ was furthest north, monsoon intensity was the greatest in 100 thousand years.


The furthest southward migration of the ITCZ culminated during the little ice age, reducing monsoon rainfall and coinciding with devastating droughts across southern Asia. A combination of an extreme southward ITCZ and El Nino-like conditions produced the drought and great famine of 1876-1878 resulting in over 7 million deaths, with India being hit hardest.


Rainfall does not fall equally across the Indian sub-continent. The so-called monsoon zone" parallels the ITCZ’s current orientation. But the winds lose moisture as they travel westward from the Bay of Bengal and move inland towards Pakistan.


Winds over the Arabian Sea from the southwest typically bring the greatest rainfall to India’s west coast and sometimes into Pakistan when the winds curl to the northwest.

As reported by Kumar (2010) rainfall over India does not provide any evidence of a global warming trend. 3 major regions of India have declining rainfall while 2 others have increasing trends. And when all the sub-divisions of those regions are examined, the majority show neither increasing nor decreasing trends.


To be fair, CO2 global warming is not expected to increase rainfall everywhere or evenly, simply due to natural variations. This is especially true for the Indian Pakistan regions that experience huge natural extremes.

The Himalayan ranges will always prevent monsoon moisture from reaching further north. So heavy rains fall on the Himalayan southside, while north of the Himalaya is extremely dry.


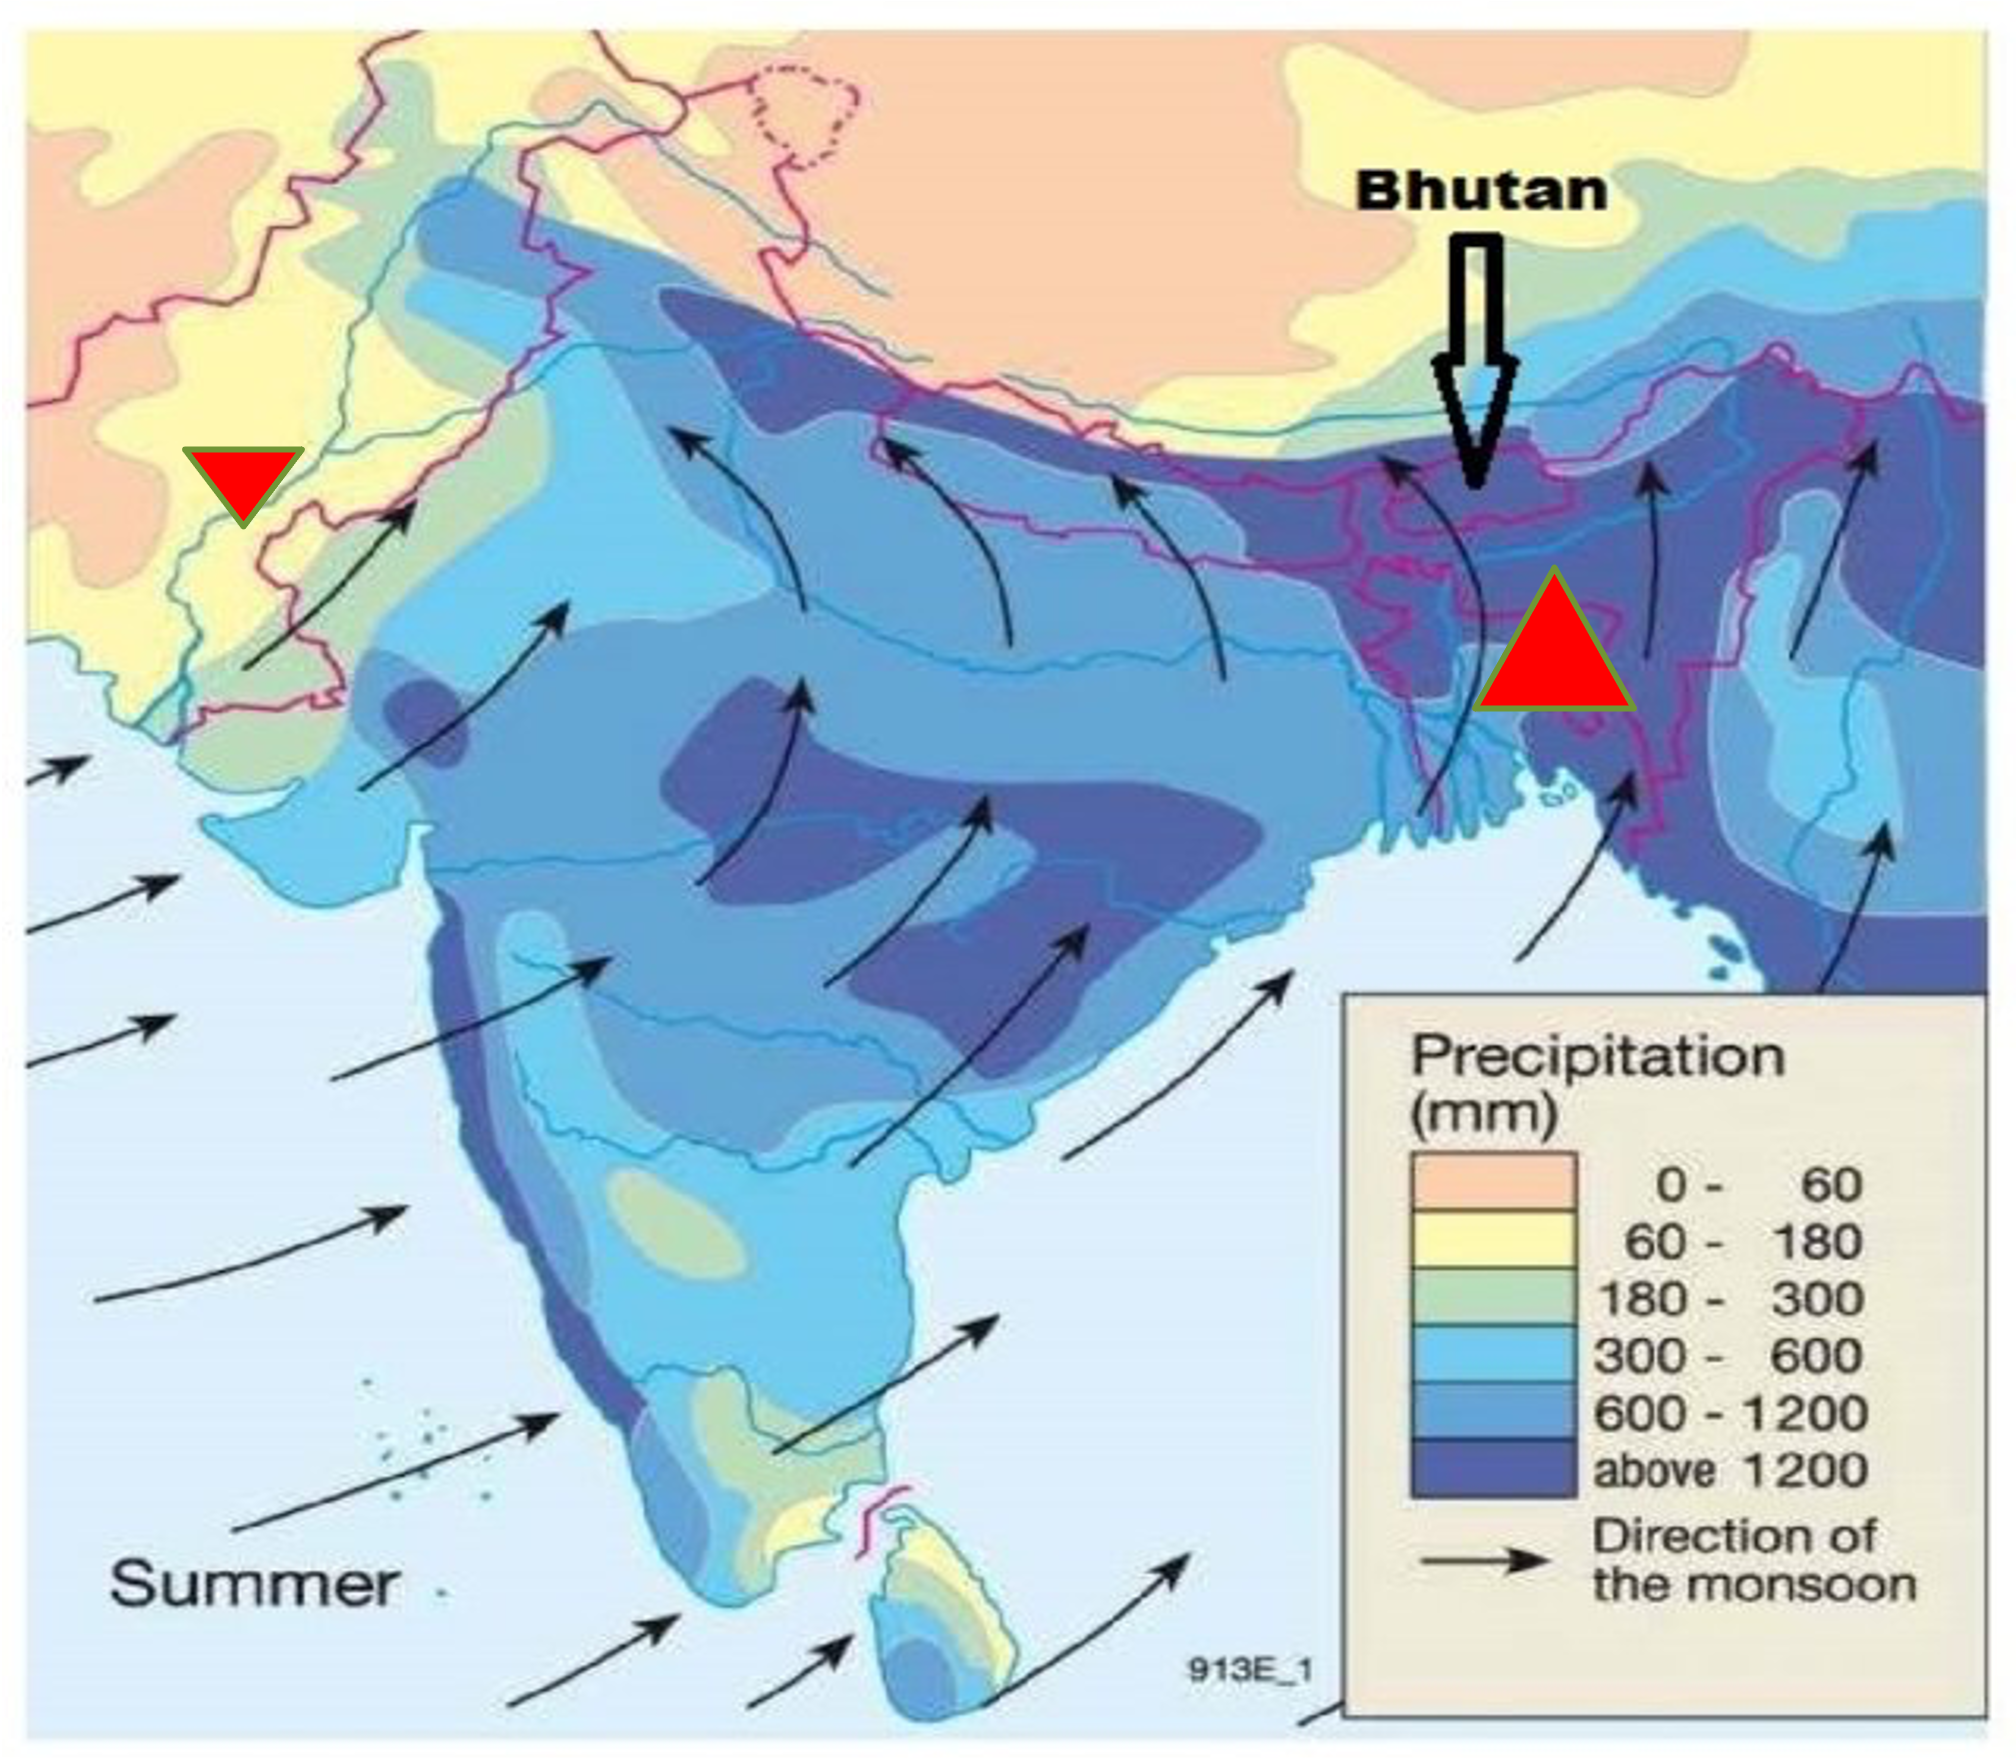
Because the southwest winds bring abundant moisture across Bangladesh and into northeast India, and the intercepting mountains provide the needed vertical uplift, Mawsynram is the wettest city in the world, marked here by the red triangle, Mawsynram receives about 467 inches of rain per year, 20 times India’s average.

In contrast, the southwest winds only bring rain to Pakistan occasionally. The lack of moisture transport into Pakistan has created 5 different desert regions. And while beneath the tropic of cancer, clear skies and the sun's direct rays produce Asia’s hottest recorded temperatures.

Jacobabad in Pakistan’s southern Sindh region, marked by a red triangle, experiences temperatures as high as 125°F (51.7 °C) nearly every year during the month of May before the monsoons start to cool the region.

The nearby archeological site of Moen-Jo-Daro holds Asia’s record for highest recorded temperature with 128.3°F (53.5°C)).

Climate crisis barkers commonly suggest rising CO2 will simply make this natural variability worse. Often arguing wet regions will get wetter and dry regions drier. But Pakistan’s floods contradicted such climate crisis claims.


In summer 2022, the wettest regions of northeast India were the driest, as illustrated by reds and yellow. There was no change in the green regions, but India’s west coast received excessive rains.

That pattern suggests global warming did not add more water vapor to the atmosphere, but instead atmospheric circulation simply shifted moisture transport from eastern India into western India and Pakistan.


In the heavily 2022 flooded Sindh region, the desert city of Moen-Jo-Daro is the site of Asia’s record highest temperature. It was first built about 5000 years ago. Then abandoned after being buried in mud from heavy flooding. Exemplifying the region's erratic extreme weather, archeologists believe Moen-Jo-Daro was reclaimed and then abandoned at least 6 times over the past 3 thousand years until finally being buried by mud for the last time.

Unfortunately, the Sindh region's natural hot zone also provides fodder for global warming fear mongering. Despite Jacobabad temperatures reaching 125°f (51.7 °c) most years, the uardian fear mongered that 51°c in 2022 was “record-breaking”. But that is a total falsehood if monthly or yearly records are being considered.


Scientists expect severe weather when they observe a weather pattern known as a dry line. Frequent dry line formation in southern Pakistan and the Sindh region makes the region vulnerable to extreme thunderstorms and flooding whenever moisture transport from the Arabian sea increases.

When moist air from the Arabian sea moves northwestward and collides with denser dry air flowing eastward from Afghanistan and the Baluchistan highlands, a dry line forms and flooding can be expected.


Pakistan's summer 2022 heavy rainfall was a regional event. Despite the low average rainfall (illustrated in orange) in Pakistan’s Sindh region, the region experienced a 500% increase in rainfall (illustrated in green). A similar increase was observed in the dry highlands of Baluchistan further west.

In contrast, the normally high rainfall in the Himalayan region of Kashmir, was the same as it usually is.


Observations of shifting atmospheric circulation have recorded that More water vapor from Arabian sea (blue line) has been most recently transported into southern Pakistan while less water vapor is being transported from Bay of Bengal into northern Pakistan (green)

Accordingly, it is southern Pakistan that is experiencing the worst flooding and infrastructure destruction (marked in brown)

Still some climate alarmists argue that global warming is melting glaciers and increasing regional snow melt. They claim that melting is adding to the river flows and thus downstream flooding in the Sindh region.


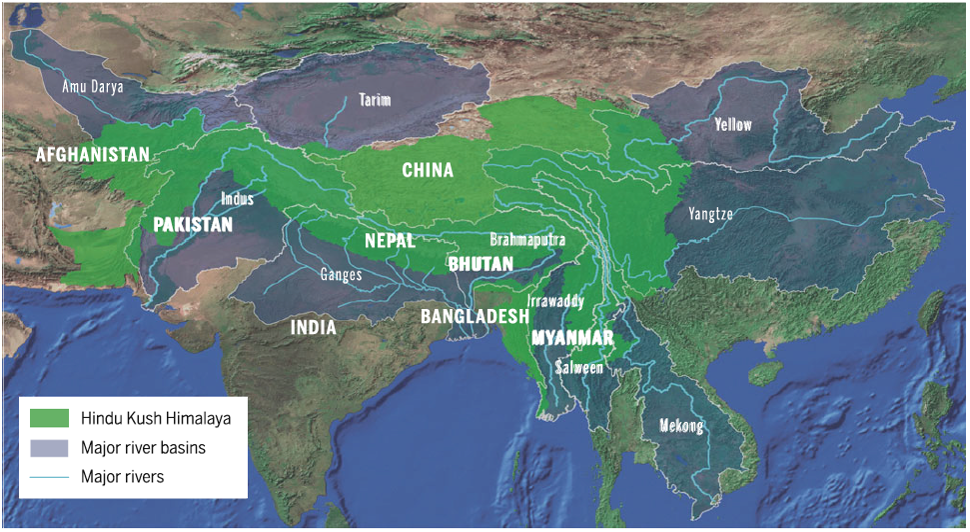
To orient you, here we see the snowmelt from the Himalaya region (marked in green) forms the headwaters for all Asia’s major rivers, Indus, Ganges, the Yellow and the Yangtze rivers. Nearly a third of Pakistan’s Indus River, flows westward through the Himalaya Then turns southward and flows to Pakistan’s Sindh region and into the Arabian sea.

It is also argued that changes in mountain snow alters the atmospheric pressure gradient that drives the monsoon water vapor from the cooler ocean onto the warmer land. More snow reduces summertime warming and thus reduces the pressure gradient and reduces the monsoonal flow.


In contrast, bare ground heats faster. That increases the pressure gradient and pulls more moisture inland. However, this dynamic is again irrelevant for the Indus River.

Despite measurable glacier retreat in the eastern Himalaya, the Indus flows through the Karakorum range of the western Himalaya. It is home to what scientists have labeled the "Karakorum anomaly".

Several studies report that glaciers in the Karakorum are not melting, but stable and even advancing, and that should reduce monsoon rains over Pakistan.


Peak flows of the Indus River and its tributaries have been carefully measured since 1921 to monitor flood threats and irrigation needs. Those measurements further contradict claims that melting glaciers have increased monsoon flooding.

The Indus River flows are illustrated by blue bars and reveal a declining trend in stream flow. The data also illustrates that flow volumes can vary by 2 to 3 times, again illustrating the highly variable Pakistan climate.


The Karakorum also has a unique temperature history. Tree ring studies determined Karakorum temperatures were warmer in the 1600s than temperatures today, adding to the list of regions not experiencing a warming crisis.

Other natural weather dynamics affect the pressure gradient between the ocean and the land that controls the monsoon strength and location.

In the simplest of terms, the Madden Julian Oscillation's 30-to-60-day migrations across the Indian ocean throughout the year alters the monsoon pressure gradient by altering the Indian ocean's pressure systems on a weekly timescale.


The Madden Julia Oscillation contributes to the alternating monsoon pattern of active phases with heavy rains and suppressed phases with little to no rain.

Jet stream meanderings also generate alternating regions of high and low-pressure systems. This causes regions of increased convection alternating with regions of suppressed convection, as well as regions where the winds pull warm moist air northwards versus regions where cool drier air is pushed southwards.


Deep convection from the Madden Julia Oscillation can also initiate a global wave train of rising and sinking air that creates alternating low- and high-pressure systems. These wave trains interact with the jet stream which enable a pathway, or wave guide, for the wave train to follow.


A common wave train pattern that affects Pakistan and India, is called the " Silk Road Pattern " and it can have a significant impact on monsoonal flows. Again in the simplest of terms, the wave train alters the monsoon pressure gradient by altering pressure systems over land.

Furthermore, the latitude of this pattern varies over decades which alters the wave trains impacts. It has moved southward (negative values) in recent decades associated with more shifts in monsoon rainfall from eastern India to western India.


And to illustrate one final example of how the earth's natural oscillations have all conspired to produce Pakistan’s floods, consider how the North Atlantic Oscillation impacts the Silk Road wave train. When the North Atlantic Oscillation is in its positive phase, the jet stream remains further to the north, and monsoon rainfall in eastern India is strong.

However, when the North Atlantic Oscillation is negative, the jet stream and Silk Road Pattern dips southward. That weakens the monsoons in eastern India while promoting greater monsoon rains in Pakistan and northern china.


When CO2 warming predictions are contradicted by both observations and science, alarmist simply default to arguing CO2 warming is just making the climate go crazy. But again, science does not support such fanciful fear mongering.

Studies by Chen 2010 concluded “climate instability is above normal during cold periods”. “There is overwhelming evidence for increased climatic instability during the Little Ice Age over the past 1000 years in northwestern china"


And it seems to be the consensus that colder periods make climate more unstable or, dare I say, crazy. Leading climate alarmist, Michael Mann likewise wrote, "the Little Ice Age may have been more significant in terms of increased variability of the climate, rather than changes in the average climate itself."

Most people don’t have the time or background to take a deep dive into climate science and uncover its truths. But there are several catch phrases that should alert everyone that it is not the science, manipulative catastrophic narratives that are preying on your sincere concerns.


So, beware when you hear or read

You are guilty of climate racism

You are guilty of promoting climate inequities

You are guilty of eating meat because cow farts are bad for the climate

You are guilty of driving a gasoline powered vehicle because they cause more wildfires & heatwaves

You are guilty of creating a climate crisis So, just give us your money!

To be clear, I am not suggesting that you shouldn’t voluntarily donate to humanitarian aid for flood victims.

I am simply arguing, when you are being falsely shamed and berated with any of the above arguments suggesting it is your fault for Pakistan’s flood, it is very likely that the media and politicians are obscuring the true science of natural climate change and trying to manipulate you.

Science and our democracy depend on interactions within a diverse array of good critical thinkers, and from such interactions the best solutions will emerge. So, please shun mindless group think.

Instead embrace renowned scientist, Thomas Huxley's advice Skepticism is the highest of duties and blind faith the one unpardonable sin.

Thank you

Thursday, August 25, 2022

SCIENCE OF SNOWFALL AND CLIMATE SNOWJOBS


Below  is the trancript to the video 


at https://youtu.be/g8udmYbXiOI


Welcome back everyone.

This video addresses another atrocious media claim, this time by Bloomberg Green, that very soon there will be an end to snow. This fear mongering has been pushed for over a decade now.

In 2000, Dr. David Viner, the senior research scientist at the Climatic Research Unit of the University of East Anglia, predicted within a few years winter snowfall will become “a very rare and exciting event”. “Children just aren’t going to know what snow is”.

But a quick review should show why such fear mongering is not supported by the science of snowfall.


Bloomberg's journalists clearly do not understand the difference between natural weather oscillations and climate change. They compared the Sierra Nevada’s heavy snowfall in 2019 with low snowfall in 2022 as evidence of a declining trend in snowfall.


But they NEVER addressed the well-known effects of El Nino and the Pacific Decadal Oscillation that cause such variations.


Studies detailing 3-fold changes in Sierra Nevada snowfall over the years have been published, such as Christy’s 2010 research paper.

By ignoring a wealth of snowfall science, Bloomberg’s so-called journalists will be better known for their ridiculous end of snow predictions.


Both the media and alarmist scientists are guilty of cherry-picking just the decline in springtime snow extent to push their end of snow fears. But during the winter, snowfall has increased And autumn snowfall has also increased.


Such contrasting trends again suggest that snow extent is not being controlled by global warming

In an interview, Dr David Robinson, New Jersey’s state climatologist and head of the Rutgers University Global Snow Lab stated,

“There are “no easy answers” to the question of climate change and snow”


Regions that cover less than 6% of northern hemisphere explain 62%–92% of the interannual variance across the continents.

Snow will change in most places as the climate continues to warm, but exactly how and why, may be among the most challenging questions about weather and climate change

So, ignore the doomsayers! Let's quickly examine why there are indeed “no easy answers”

As temperatures fall, significant snowfall happens each winter in the northern two thirds of the United States. The locations illustrated here in red experience the heaviest snowfall and are governed by very different moisture transport dynamics, prohibiting any one size fits all analysis of changes in global snowfall.


First remember what every elementary school child is told; no two snowflakes are the same. That may not be entirely true, but it speaks to the varying conditions of temperature and moisture that control snowflake formation, creating a huge spectrum of differing snowflake crystals that produce different snowpacks, from heavy wet snow to dry powdery snow.


So, it could also be argued no two snowpacks are exactly alike. The density and thus water content of snowpacks can vary 3-fold. Depending on when the snow falls the snowpack can become denser over time.so simply measuring the extent of snow cover from satellites, fails to determine how much water fell as snow So, scientists use snow water equivalent measurements, but those measurements require time consuming efforts and thus provide a very limited sample size of snow conditions.


Still, we do know that El Nino cycles and the Pacific Decadal Oscillation have very significant impacts on the snow water equivalent. Thus, the effects of natural oscillations must be considered for any analysis of snowfall trends.

Temperature and moisture have opposing effects on snowfall. As temperatures decrease to the point where snowflakes can form and reach the ground, the amount of moisture in the air decreases reducing the amount of snow

The northern hemisphere's latitudes with greatest snowfall are also regions with the lowest winter atmospheric moisture.


Predictions that global warming will melt more snow, suggest the biggest declines in snow extent will happen at the relatively warmer southerly edge of the northern hemisphere's snow extent.

But as surveyed by Kunkle 2016, the pattern of decreasing and increasing snowfall does not fit global warming expectations, again suggesting that varied dynamics of moisture transport are the key to understanding snowfall variations.


Furthermore, many studies unscientifically simply assume a global average temperature affects all regions equally. But as illustrated by Cohen 2014, much of the mid latitudes have experienced winter cooling for the past 2 decades.

And in contrast to global warming hypotheses, despite cooling over most of Eurasia, that region has experienced less snowfall.

Warmer air holds more moisture. And it is the transport of that moisture to cooler regions that provides enough water vapor for significant snowfall.


If warm air at 20 degrees Celsius is cooled to the freezing point, it will precipitate over 60% of its moisture. Typically, atmospheric rivers bringing moisture from the warm tropics will dump the most snow when making landfall further northward.

In contrast, because cold arctic air masses averaging minus 10 to 30 degrees Celsius, that cold air hold insignificant amounts of moisture, and cannot bring significant snowfall directly to the regions it passes over.

Nonetheless that cold air can cause warm air water vapor to precipitate as snow.


Typically, all moisture at higher altitudes forms snow, but if it descends through a warmer air mass, it turns to rain.

If that rain then falls through a colder air mass nearer the ground it forms sleet or freezing surface rain.

By preventing melt, snow accumulation only happens where the air is cold enough all the way to the surface.

At weather fronts, cold air will force warm moist air to rise to altitudes where temperatures are cold enough to initiate snowflake formations


As storms move across the land, the counter-clockwise motion of the winds pulls cold air down from the north to interact with warm moist air being drawn northward.

Thus, the more northerly latitude of winter storm tracks will more likely produce the cold air required for snow accumulation. However, as storm tracks move northwards, snow fall could be reduced further south.

However, studies find that although storm track latitudes have varied over the past 300 years there is no apparent trend as expected from global warming theories.


Mountains have a tremendous effect on snowfall. Moist air forced upslope to cooler altitudes is the reason the greatest snowfall in the United States is found in mountainous regions.

Although snow rarely falls over the west coast flatlands, just a hundred miles further east, heavy snow falls in the Sierra Nevada and cascade mountain ranges.


The amount of snow is governed by El Nino cycles. El Nino brings warm moist air to the southern USA. Accordingly, studies such as Lute 2014 have detailed how El Nino years bring high snowfalls to the Sierra Nevada, but reduced snowfall to the Pacific northwest.

A swing to La Nina-like conditions brings dryness to California and the southern United States. The reduced Sierra Nevada snowfall of 2022, and fear mongered by Bloomberg’s “ End of Snow” click bait atrocity, was the result of reduced moisture transport associated with current La Nina conditions and a negative Pacific Decadal Oscillation.


La Nina, however, directs more moisture northward causing more snow in the pacific northwest and the northern United States

Other studies have shown oscillating years of much more vs much less snowfall in the Sierra Nevada for the last seven decades.

In the northern Sierra Nevada, there was an insignificant decreasing trend.

But an insignificant increasing trend in the southern Sierra Nevada

And at low elevations in the southern Sierra Nevada where global warming hypotheses expect the greatest loss of snow, there has been an insignificant increase in snowfall


The heavy snowfall in the Rocky Mountains is also partially determined by El Nino cycles. However, the moisture carried from the pacific by westerly winds during the winter loses much of that moisture before reaching Colorado, resulting in the dry powdery snow that is so favored by skiers.

But that changes in the spring!

A low-pressure system settles in during the spring causing easterly winds to carry moisture from the Gulf of Mexico westward. These dynamics deliver wetter snow and as much if not more snow than falls during the winter.


Despite the lack of mountains, the midwestern USA experiences heavy snowfall from lake-effect snow. Cold dry Arctic air will absorb copious moisture as it passes over the relatively warmer great lakes and then dumps it inland.

Studies associated with NOAA have mapped out the contributions from lake-effect snow. They reported that while non-lake-effect snowfall has decreased in Illinois, Indiana and Ohio, lake-effect snow has increased.


They attributed the increase in lake effect snow to declines in ice cover caused by global warming. But that is inaccurate and not very truthful for a government sponsored scientific study.

It has been well established that lake effect snow is governed by many variables: Besides ice cover, wind speed and wind direction have major impacts. When the winds blow along the long axis of a lake more moisture is absorbed, and greater snowfall occurs.

Indeed, ice cover does have a major effect, however only lake eerie ever completely freezes each year, while most of the deeper lakes maintain large areas of open water illustrated here by dark purple colors.

Although ice cover declined as NOAA noted from 1975 to 2000. Ice cover then increased from 2000 onward, contrary to global warming predictions of declining ice cover.


Cold dry winds blowing from Siberia absorb moisture as they cross the Sea of Japan. Upslope snowfall then deposits great amounts of snow on the mountain tops leaving very little moisture to reach Japan’s east coast


The strength and direction of those winds changes as the high-pressure system over Siberia varies.

The strength and location of the Aleutian low pressure system, which is altered by El Nino cycles and the Pacific Decadal oscillation, also alters the pressure gradient which controls the strength and direction of the winds and thus the amount of sea-effect snow accumulation.


Due to such variability, Japan’s local snow accumulation has exhibited no trend in one location,

increasing snowfall trends in others,

and decreasing trends in still others.


The last region in the United States of high snowfall is in the northeast.Moisture from the Atlantic is delivered via winter storms known as "nor-easters" and dumped in the higher elevations of the Green or White Mountains further inland.


Snowfall here is largely governed by moisture transport that varies with the Atlantic Multidecadal Oscillation and the North Atlantic Oscillation.

The related Arctic Oscillation determines where and how much cold Arctic air moves southward to interact with relatively warm moist air flowing from the Atlantic.


The many possible interactions amongst the natural oscillations, described in this video, have huge effects on moisture transport and thus snow accumulation.

So snowpacks will naturally ebb and flow accordingly.

Thus, the great complexities governing snowfall across the northern hemisphere indeed provide no easy answers regards the effect of climate change.

So don’t believe the doomsayers. The science has yet to support their fear mongering.


And don’t hesitate to buy your children winter sports equipment. There will be plenty of snow most years for them to enjoy.

And I am so confident of the science of snowfall, that I promise to reimburse everyone's winter sports expenditures, if "the end of snow", ever really happens in our lifetimes!

Monday, August 15, 2022

Australia’s Mangroves: BBC & ABC’s Disturbing Fear mongering with Scientific Dishonesty and Idiocy


Australia’s Mangroves: 

BBC & ABC’s Disturbing Fearmongering with Scientific Dishonesty and Idiocy 


I want to thank Dr. Alan Longhurst for alerting me to the BBC’s fearmongering. He requested that I address the media’s perversion of science. Dr. Longhurst (now 97 years-old) is one of the world’s premiere oceanographers, inventor of the Longhurst-Hardy Plankton Recorder, served as the first Director of the Southwest Fisheries Science Center of the US National Marine Fisheries Service and Director of the esteemed Marine Ecology Laboratory of Canada’s Bedford Institute of Oceanography, among other prestigious positions and tropical research. 

 (The photos and captions are screenshots from BBC: Mangrove forests: How 40 million Australian trees died of thirst.) 


 The BBC’s short video begins by showing devastated mangrove forests form northern Australia’s Gulf of Carpentaria from a 2015-2016 die-off. The BBC and ABC (Australian Broadcasting Company) framed this natural event as a human-caused climate change disaster, to perpetuate the myth of a climate crisis. 


Mangrove specialist Dr Norman Duke attributed the episodic 2015 die-off to a 40 cm drop in sea level for 6 months due to an El Nino that caused the mangroves to “die of thirst”. Duke acknowledged that it is well known that El Ninos naturally cause such major drops in sea level in the western Pacific. But there is no evidence, nor any consensus, that El Ninos have been made worse by rising CO2. It is known however, that El Nino activity has increased over the last 6000 years as the earth cooled since the Holocene Optimum due to changes in the sun’s orbital cycles. 


Duke estimated that about 7,400 hectares (74 km2) of mangroves were lost. That would amount to no more than 2% of the total mangrove covered forests in the Gulf of Carpentaria. Mangroves are salt-tolerant shrubs and trees that grow in warm, coastal waters. The areas of severe dieback matched zonation contours, where higher elevations were drier and most vulnerable to sea level fall. 

 In 2017, Duke published, “Large-scale dieback of mangroves in Australia’s Gulf of Carpentaria: a severe ecosystem response, coincidental with an unusually extreme weather event”. He reported that mangrove diebacks “occurred when regional annual rainfall levels were low, temperatures were high and sea levels were notably lower at the time.” And those conditions correlated with “the El Nino–Southern Oscillation (ENSO) cycle for this region”. 


 Although mangroves are tropical, and their expansion is linked to warmer conditions, and are known to be reasonably heat tolerant, Duke (2017) attempted to draw a connection with global warming, mentioning there were exceptionally high temperatures recorded at the time and “coincidental with heat-stressed coral bleaching”. Coral bleaching attributed to global warming was being tearfully pushed by Duke’s colleague Terry Hughes. Hughes’ catastrophic global warming narrative is now being refuted by the rapidly rebounding Great Barrier Reef corals. Such good news might be the driving force for Duke and the BBC to resurrect a catastrophic mangrove narrative to protect and support inane climate crisis narratives. 


 Duke (2017) had noted mangrove losses and retreat were linked to drought, decreased precipitation and temporary drops in sea level. All those weather conditions, including warmer temperatures due to reduced cloud cover, are all associated with El Nino events, as warm tropical waters slosh eastward across the Pacific. Falsely, the BBC, ABC and Duke are now oddly claiming the mangrove die-off and El Nino connection is newly discovered. 


 But others had also reported the El Nino effect at least 5 years ago. Lovelock (2017) in Mangrove dieback during fluctuating sea levels wrote “During El Niño, weak equatorial trade winds cause the thermocline to shoal in the tropical western Pacific and the presence of cool water results in sea levels that can be lower by 20–30 cm”. “Because both low sea level and low rainfall co-occur during El Niño years in the Indo-Pacific region, intensification of ENSO in the coming decades with climate change may be particularly unfavorable for productivity of mangrove forest ecosystems.” 


 Still the BBC and Duke doubled down on a climate crisis connection with transparent idiocy and sleight of hand. They seamlessly switched from blaming a natural fall in sea level for the die-off, to expressing concern that rising sea levels from global warming would hinder mangrove recovery. Yet that desperate claim is easily refuted, and in fact has been refuted already in the peer-reviewed scientific literature. 


 In 2016 Asbridge published “Mangrove response to environmental change in Australia’s Gulf of Carpentaria”. That study concluded, “increased amounts of rainfall and associated flooding and sea level rise were responsible for recent seaward and landward extension of mangroves in this region.” For the period 1987–2014, “mangroves were observed to have extended seawards by up to 1.9 km (perpendicular to the coastline), with inland intrusion occurring along many of the rivers and rivulets in the tidal reaches.” 


 But such knowledge did not prevent Duke and the BBC from descending into the depths of stupidity and call for paradoxical, useless and expensive remedies to “save” the mangroves. Duke wants to water the mangroves from the air or from ships to prevent them from drying and dying. The rationale for such stupidity: mangroves store carbon. They worried that the mangrove die-off released “1 million tonnes of carbon into the air”, and the ABC added that’s the “equivalent to 1,000 jumbo jets flying return from Sydney to Paris.” But mangroves have naturally dried and died before. No wonder great scientists like Longhurst fear the current perversion of science driven by climate alarmism.


Sunday, July 31, 2022

Why the Sun, Not CO2, Heats the Oceans Revisiting the Debate: Does Greenhouse Back-radiation Warm the Oceans?


Why the Sun, Not CO2, Heats the Oceans 
Revisiting the Debate:  Does Greenhouse Back-radiation Warm the Oceans?

This is the transcript for the video published on youtube 
https://youtu.be/61VxYVIHW-U


Welcome everyone.

About a decade ago there was a heated and unresolved debate on whether infrared back radiation from greenhouse gases is heating the oceans. Because infrared penetrates less than a millimeter into the ocean's surface, many skeptics argued it is impossible to blame rising CO2 for ocean warming. However, several prominent skeptic scientists, people who I have great respect for, also weighed in arguing it was silly and useless to argue infrared heat can't warm the ocean.

After analyzing the physics detailed in this video, I’m convinced it is solar energy that drives the observed ocean heating, and any infrared ocean heating is insignificant at best. If this analysis holds, it is another significant strike against the prevailing CO2 driven global warming theory

To ensure lay people are brought up to speed, here's a quick summary of where consensus climate science stands today.


Climate scientists construct models of the earth's energy budget. The amount of energy absorbed by the earth or emitted back to space each second, is measured in Watts and is standardized for an area measuring one square meter. For those unfamiliar with that measurement, simply understand that more Watts signify more energy.

The energy budget illustrated here was published by Stephens 2012. Others have slightly different numbers, but this illustration is one of the best because it is one of the few that lists the range of uncertainties in their measurements.

Because the sun's surface is so hot it emits high energy shortwave radiation. On average the earth warms as short waves add 75 Watts to the atmospheric water vapor while the earth's surfaces absorb about 160 Watts, totaling 240 Watts that are heating the earth's daytime climate.

According to the Stefan-Boltzman law, and remember scientific laws are undisputed, when a surface is heated it causes that surface to respond immediately by releasing an equal amount of energy from that surface.

To maintain the earth's temperature balance, the 240 Watts of energy from the sun should cause the earth to emit 240 Watts back to space or transfer some of that energy from the surface into the oceans or soils. However, because the earth is so much cooler than the sun, it only emits that energy as longwave infrared waves, which interact very differently with the earth than the sun's shortwaves.

While some longwaves can escape back to space unimpeded and at the speed of light, other longwaves can be absorbed by greenhouse gases like carbon dioxide and water vapor. Greenhouse gases then re-emit that absorbed energy, and redirect half back towards the earth's surface. On average the earth's surface also absorbs an estimated 345 Watts of re-cycled longwave energy which counteracts the rate of cooling and prevents the earth's nighttime cooling from dropping to the point of global freezing.

However, that longwave energy is not trapped, as many media headlines suggest. Eventually nearly all the energy from the sun escapes back to space. However, the best modeled energy budgets suggest that a slightly less amount of energy radiates back to space relative to what had originally entered from the sun.

Putting aside some large uncertainties, there appears to be a radiative imbalance of 0.6 Watts less energy leaving the earth than is added by the sun. Some researchers estimate that imbalance may be as high as one Watt.

That imbalance does not violate the Stefan-Boltzmann law because that missing heat gets stored below the land surface or below the ocean surface, where the heat cannot radiate back to space in a timely manner.

There is no scientific disagreement that our oceans have been warming since the Little Ice Age ended around 1850 AD. What remains to be debated is, to what degree are oceans naturally warming due to storage of more shortwave energy from the sun, or due to storage of increased downward longwave energy emitted by rising carbon dioxide concentrations.

Some have argued, incorrectly, that the earth's land surface heats and cools the same as the oceans.


However, in contrast to the ocean, the suns' shortwave energy doesn’t penetrate soils much deeper than an inch. The combined heating from shortwave & longwave energy plus sensible heat transfer from warm air, increasingly heats soils at the surface reaching summertime highs. Then, primarily via conduction, surface heat slowly passes down the temperature gradient from the warm surface to cooler depths in accord with the second law of thermodynamics. Heat transfer via conduction is slow, so temperatures can remain 8ºC (15 º F) cooler just 10 inches (25 centimeters) below the surface.

During the winter, the colder surface reverses that temperature gradient, so that stored summer heat travels via conduction back to the surface. Again, because surface cooling happens quickly and conduction happens slowly, the deeper soil remains warmer than the surface soil.

Greenhouse longwave energy penetrates only a few microns into the ocean surface and even less into most soils, but the sun's shortwave energy passes much more deeply into the ocean.

More energetic shortwaves like blue light can penetrate over 100 meters (that’s about 4000 inches) into clear ocean water, with only half its energy absorbed within the first 20 meters. In contrast 50% of less energetic red light is absorbed in just the first few meters. That's why seaweeds in the deeper ocean cannot use red light to photosynthesize like land plants do.

Although both the heating of the land and ocean depends on surface heating, radiative and convective heating are much more important for heating the ocean. This causes important differences in the way our oceans heat and cool, thus analogies to land surface heating are misleading.


This standard, albeit overly simplistic ocean temperature profile, shows the upper layer of the ocean, often referred to as the epipelagic layer or sunlight layer, extends from the surface to 200 meters depth. Turbulence due to winds and currents mixes and homogenizes the temperature as illustrated here and globally averages 13°C or (55 °F).


Below that mixed surface layer is the thermocline layer, defined as a region of rapidly cooling temperatures, because mixing of warm surface heat into the layers below rapidly declines with depth. .

At a depth of about 1000 meters and below there is a more homogeneous temperature of just 4°C or 39°F However, the illustrated homogeneous upper sunlight layer obscures the most important dynamics of the oceans' surface skin layer that are key to controlling ocean heating and cooling.

A 2018 paper by Wong & Minett analyzed ocean temperatures from data collected during 2 ocean cruises in warm tropical and subtropical waters of the north Atlantic. They reported important differences in heating and cooling patterns in the microns-thick surface skin layer and millimeter thick subsurface layers. 


For perspective, the sharpened point of a pencil is about one millimeter wide. It takes one thousand microns to equal just one millimeter. The ocean’s surface gatekeeper is only a couple of microns thick.

Only 4.9 Watts per meter squared of solar energy was absorbed in the first 10 microns. .

In contrast, the subsurface was increasingly heated, so by 10 millimeters deep, 261 Watts of solar energy were absorbed.

Only at the surface can any ocean heat be released back to the atmosphere or space. So, this differential solar heating creates the required temperature gradient that allows the solar heated subsurface water to constantly move up towards the cooler surface.

Heating by longwave energy adds another complication that must be considered. Longwave energy only penetrates the first few microns of the skin layer. And that fact prompts some skeptics to argue CO2 back radiation cannot heat the ocean.

But on the other side of the debate, it is argued that because longwave heating can add 100 times more energy into the skin layer than solar heating, longwave heating can alter and even reverse the temperature gradient required for ocean cooling.

But if true, then how does the ocean ever lose heat.

Nonetheless, the alarmist narrative becomes that added infrared energy must alter the temperature gradient to some degree. Therefore, as more greenhouse gases add more longwave energy to the surface skin layer, it increasingly disrupts the temperature gradient enough to reduce the rate of subsurface cooling. So, rising CO2 is indirectly warming the ocean.

But measurements do not support such narratives.

Satellite measurements determined the oceans' surface temperature by measuring the longwave radiation emitted from the skin layer. The sub-skin layer below was also measured but via emitted microwaves.

The results show the ocean's skin layer is always cooler than subsurface layers below, despite the combined surface warming by shortwave and longwave heating plus rising heat from solar heated waters below


In the daytime, there is a deeper solar heated diurnal warm layer. At night, without solar heating, subsurface waters eventually cool and mix with the water below creating a more homogeneous upper layer temperature everywhere except in the cooler skin surface.

No matter the season, or time of day the skin layer is always cooler than the waters immediately below.

Although not intuitive, the constant cool skin surface phenomenon can be explained by the Stefan-Boltzman law. According to that law, when the skin surface layer is heated, by longwave or shortwave energy, the surface skin layer radiates an equal amount of energy back to the atmosphere immediately. Any longwave heating of the skin surface layer is so transitory there is no observable effect on the temperature gradient that's required to cool the ocean's solar heated sub-surface layers.

As Wong & Minett's results illustrated, the micron thick skin layer absorbed 410 Watts of longwave and a negligible amount of shortwave, but simultaneously emitted 470 Watts out of the ocean, maintaining the observed cooler skin layer.

The 470 Watts of longwave-out vs 410 Watts of longwave-in does not violate the Stefan-Boltzman law because the skin surface heating is the combined result of warming from 67 Watts of solar heated water rising from below and the downward longwave radiation from above.


That combined heating also caused the skin surface to lose a total of 7 Watts more from sensible heat loss to the cooler air above via conduction, and more latent heat due to evaporation from the skin surface. Thus, on average the skin surface cooling balances skin surface heating, but the skin surface remains slightly cooler because it radiates heat away faster than subsurface heat can rise from below.

Still their data raises one concern. It is very unusual that their estimated heat loss via sensible and latent heat was a mere 7 Watts of cooling. That is 15 times less than globally averaged ocean cooling rates.

It is well established, that the energy needed to evaporate enough water that's observed in the earth's water cycle, oceans must experience over 80 Watts per meter squared of evaporative cooling.

Acknowledging the conundrum that those longwave energies do not penetrate deeper than a few microns and thus cannot warm the oceans directly, the stated intent of Wong & Minett's analysis was to advance their hypothesis that more co2 longwave energy can still warm the ocean indirectly by reducing the temperature gradient and thus, reduce the rate of cooling of the ocean's diurnal warm layer.

To support their claim, they argued the absorption of more longwave into the skin layer, did not result in the required increased surface temperature that would immediately increase emissions and balance the longwave energy surface budget.

To that end, they examined the increased longwave heating produced on cloudy days as an analog for the effects of increased longwave heating from rising carbon dioxide.

Their highlighted results illustrated here, show that despite an increase of 40 Watts of longwave heating from cloudy skies, there was no increased cooling via emitted longwave-out and no increased loss of sensible and latent heat so the cooling temperature gradient must have been disrupted. But that would violate the Stefan-Boltzman law, their narrative requires magical thinking.

In reality the Stefan-Boltzman law was never violated. It was simply a bad narrative. Although increased cloud cover did increase longwave heating, cloud cover simultaneously reduced the shortwave solar heating of the layers below the skin surface.

The reason 40 increased Watts of incoming longwave did not also increase outgoing longwave is due to the fact that clouds equally reduced the solar heating of subsurface waters. When long wave and shortwave heating are both considered, the balance between incoming and outgoing heat at the skin surface was maintained as predicted by the Stefan-Boltzman law.


Others have argued that warmth generated by longwave heating of the skin surface would be transported quickly downward by mixing with layers below.

However, downward mixing of the observed cooler skin layer would only cool the warmer subsurface layers. While any mixing that brings warmer subsurface water up to the surface, only enhances its cooling.

Only the mixing of deeper solar- heated subsurface waters with the cooler waters below, carries heat deeper into the ocean. The mixing of solar heated water into deeper layers, then makes solar heat less likely to resurface and cool.

Thus, it is the downward mixing of solar heated waters, not the transitory longwave heating of the skin surface layer that stores energy in the ocean and creates the estimated energy imbalance.

Taking a broader global view, analyses of heat flux into and out of the world's oceans illustrates where the oceans are warming. Huang's (2015) illustration of ocean heat flux contradicts claims that a thickening global blanket of CO2 is heating the world's oceans.

Nearly half of the ocean surfaces, regions colored green, show no net heat flux into or out from the ocean.

The regions of greatest heat flux into the ocean are colored red.

There, the intense tropical heating is further amplified by the reduced cloudiness observed in the tropics, as published in Fasullo and Trenberth’s 2008 study.

Furthermore, the tropical trade winds cause greater upwelling of cold deep water in the eastern Atlantic and eastern Pacific.

Colder waters on the surface can reverse the typical heat flux so that heat flows from the warmer air above into those colder upwelled waters.


The obvious clue to the primary driver of ocean warming is that the regions of greatest solar flux into the ocean are the same regions created by pacific and Atlantic La Ninas. That solar heated water is transported westward and then poleward along ocean currents where the greatest amount heat is vented, (colored dark blue. The Holocene optimum, with temperatures warmer than today happened during perpetual La Nina conditions.

For details on how a solar heated ocean causes our current warming trend, please watch my earlier video: Global Warming Driven by Pacific Warm Pool, La Nina & ITCZ: an alternative climate change theory or read its transcript.

To date there has been no provable mechanism illustrating how heating from CO2 can heat anything more than the ocean's skin surface. In contrast the combined climate effects of solar heating, the ITCZ migrations and La Ninas are strongly supported in the peer-reviewed scientific literature.


So, I will ignore the click bait news media's fear mongering that our oceans are "on the boil" due to rising CO2. There is simply no scientific proof to support such dishonest narratives.

And I will sleep well. There is no climate crisis.


Our democracy depends on a diverse array of good critical thinkers. So, please shun mindless group think.

Instead embrace renowned scientist, Thomas Huxley’s advice Skepticism is the highest of duties and blind faith the one unpardonable sin.

And if you appreciate the science clearly presented here, science rarely presented by mainstream media then please