Translate

Tuesday, March 7, 2023

Setting Senator Whitehouse Straight on Climate & Wildfires


This is the transcript for the video Setting Senator Whitehouse Straight on Climate & Wildfires

https://www.youtube.com/watch?v=07juDXNa72M


Not enough politicians are honestly educating the public about the science of climate change and wildfires.


Senator Whitehouse has pushed climate misinformation mostly offering conspiracy theories that argue skeptical science is fabricated & paid for by the dark money of fossil fuel companies. He compares skeptics to a “ventriloquist’s wooden painted dummy" and controlled by fossil fuel companies. In his numerous "Time to Wake Up" speeches, senator Whitehouse has fear mongered wildfires as evidence of a climate crisis, such as highlighting Colorado’s most destructive Marshall Fire.

Now as the chairman of the senate's committee on the budget, he pushes speculation on the extreme cost of climate change. This March 9th 2023 his committee focuses on wildfires.

I was being considered to be one of the expert witnesses for that hearing but did not make the final cut. So, instead I’ll present what I had prepared for broader public consumption. I'm an ecologist and environmentalist, free of any fossil fuel manipulation, so I’m titling my contrasting presentation "Time to Learn Some Science".


There is no evidence supporting claims that rising CO2 and global warming increases the spread or intensity of wildfires. The intensity and spread of the destructive Marshall Fire was governed by the flammability of the grassland and the winter winds.

In winter, the vegetation is dead or dormant, so moisture content reaches its seasonal low.


The Marshall Fire was a grass fire. Grasses become highly flammable in just hours of dry weather. Grasses become highly flammable independent of climate change. The Marshall Fire was not evidence of a climate crisis!

The Marshall Fire was ignited by humans.

Human ignitions have expanded fire season into the coldest seasons, making deadly fires less predictable. Natural lightning fires are more predictable in the summer months of the more limited lightning season.


Like the Marshall Fire, humans caused California's most deadly fire, the Camp Fire, due to faulty electrical apparatus in October. Also in October, faulty electrical caused California's 4th most deadly fire, the Tubbs Fire.

Electrical sparks ignited California's 2nd largest fire, the Dixie Fire as well as its 9th largest, the Thomas Fire. A mere spark from a stake hitting a rock in a grassy pasture ignited a section of the 3rd largest fire, the Mendocino Complex Fire. An escaped campfire caused the 12 largest, the Rimm Fire And a highway accident caused the 14th largest, the Carr Fire.

As grass fires are want to do, the Marshall Fire went from ignition to an out-of-control state in less than one hour


Despite strong winds, temperatures were below freezing, and relative humidity was above average, conditions not considered to be worrisome fire weather. So, the National Weather Service did not issue a red flag warning that day.

However, the drying Chinook Winds were strong enough that a no-burn restriction was rightfully issued. Strong winds will carry an escaped fire into human habitat with devastating speed.

California's Santa Ana & Diablo winds have similarly spread California's worst fires. All these winds peak in winter as cold air flows down the mountains. Any global warming should reduce these winds.


Fires require high amounts of energy to ignite and spread.


It is well proven that increasing CO2 from burning fossil fuels adds about 2.4 W/ m2 of energy. But that cant ignite even a paper fire.

In contrast,  3,400 W/m2 will ignite grassy vegetation in seconds.

It is also well proven that grass fires emit about  35,000  W/m2 of energy.

 Depending on the vegetation density, that's 10 times more energy than what's needed to sustain a grass fire.


Thus, the added energy from CO2 adds only 0.007% to the energy that a fire emits So, the added energy from CO2 is insignificant regards the drying and spread of a fire.

Once a grass fire ignites a house, the house generates so much heat its ignites neighboring houses causing a fire siege that destroyed this whole community. Studies of burning furniture find a burning mattress alone releases nearly 4 million watts of heat.


In contrast to Whitehouse's call for a CO2 safety zone, a defensible space is created only by removing any vegetation that carries a fire too close to one's home. Only then can a reasonable wildfire safety zone be realized.

The introduction of Eurasian cheat grass over 100 years ago, has enabled increased fire ignitions and created more pathways carrying fire into shrubland, forests and rural towns. Cheat grass creates a dense carpet of highly flammable fuel that dies and dries by June and cheatgrass' spread is one correlate with the disproportional number of fires in the west.


If the senator wants to minimize deadly fires, the budget committee should consider more support for restoring native vegetation.

The deep rooted, native perennial grasses that cheatgrass replaced, produce moist live foliage through august and create a mosaic of grassy clumps and bare ground that slows the spread of fires.

Similarly, in forest habitat, money would be best spent increasing prescribed burns and forest thinning to create a mosaic that again reduces wildfire spread.

Fires were far more common in the early 1900s when CO2 was lower and temperatures were cooler as demonstrated by the Oregon Department of Forestry. Likewise, fires were far more common throughout the American southwest during the Little Ice Age.


Fire suppression policies that began 100 years ago and were meant to save forests, instead caused forest fuels to accumulate, unintentionally resulting now in more intense and devastating fires

Lightning is the cause of natural fires. Despite a lightning strike raising air temperatures by 50,000 F, a strike usually doesn’t ignite living trees due to the trees' high moisture content and the lightning's short duration. Lightning is also less likely to start a fire when accompanying rainstorms.


Interestingly, California accounts for 31% of all of America's burnt area from lightning, despite having one of the lowest densities of lightning strikes.

However dry lightning is more common in the arid western USA and is another correlate explaining the disproportionate number of fires in the western USA.

Accordingly, California's largest fires were due to a summer swarm of dry lightning strikes in 2020. Dry lightning caused California's all time biggest recorded fire, the August Complex Fire, in addition to causing the 4th and 6th largest fires.

In contrast, Florida is hit by 50 times more lightning strikes per square mile. Yet, although California is just 3 times larger, California's burnt area is 20 times larger than Florida's, despite both states being equally affected by rising CO2.

This difference correlates with the fact that California has the least amount of summer precipitation during lightning season while Florida has the most. Thus, it's California's Mediterranean climate that makes it naturally prone to dry lightning, drier fuels, and larger wildfires.


A Mediterranean climate's dry summers happen each summer because a clockwise-spinning high pressure system sets up and diverts moisture-carrying storms northward & away from California inhibiting its summer rainfall.

Although a similar high pressure sets up in the Atlantic, the same clockwise spin drives more rain into the Gulf and east coasts, explaining why the eastern USA has far fewer fires.

The Pacific high-pressure system fades in winter allowing California to receive more rainstorms, but La Nina-like oceans can maintain higher pressures during the winter, resulting in more drought, particularly in California.


La Nina's are natural. So, CO2 driven models have failed to accurately simulate their occurrence. Scientists are struggling to understand why their models predicted more El Nino-like oceans as CO2 increased, in contrast to the past 40 years of observations finding the pacific has become more La Nina like.

Finally, climate alarmists and mis-informers have been cherry-picking & weaponizing the tragedies of the Marshall Fire & California's fires, as evidence of global warming catastrophes. However, the global burnt area declined by 25% between 2000 and 2017, again contrary to global warming predictions.


The red areas show where burnt areas have significantly increased, blue significant decreases. All the white areas represent NO trend and reveal neither the USA nor the world show any indication of a growing wildfire crisis or any correlation with rising CO2.

So, indeed wake up America, it is time to learn some science!


Thank you

Monday, February 6, 2023

WHY COOKING WITH GAS WONT MELT ARCTIC SEA ICE or How Temperature Anomaly Graphs Obscure Important Climate Dynamics


This is the transcript for video 
WHY COOKING WITH GAS WONT MELT ARCTIC SEA ICE or How Temperature Anomaly Graphs Obscure Important Climate Dynamics


Video reveals the critical climate dynamics of ocean currents that naturally transport warm warm water from the tropics into the Arctic causing very different local temperatures and changes in sea ice extent.


Welcome back everyone. 

Today I want to demonstrate how the focus on temperature anomalies severely misleads the public about the natural dynamics of climate change

Indeed, as illustrated here by NASA’s 2016 winter temperature anomalies, the data shows the rctic is warming 4 times faster than elsewhere and winters are warming faster than the other seasons.

However, a dubious narrative uncritically attributes rising CO2 to those anomalies, then speculates about a future warming crisis while ignoring important natural dynamics such as ocean currents.

But there is a wealth of scientific research that has shown ocean currents can also cause those higher temperature anomalies, but that isn’t obvious from this anomaly illustration. To add to the misunderstanding, the high Arctic temperatures are paradoxically due to heat ventilating out from the ocean and cooling the earth, thus actually preventing future extreme warming.

The warm 2016 winter temperatures in the eastern tropical Pacific were caused by a natural El Nino event that also ventilated heat previously stored in the western Pacific, briefly warming the air but again actually cooling the earth.

El Nino events also contribute to warmer sea surface temperatures simply by reducing the trade winds that drive upwelling of cold subsurface water. Such warming when upwelling is inhibited is observed globally. For example, a 3-month study showed how monthly changes in wind direction (the blue line) caused a 6 to 8C (14F surface temperature change.


Along the coast of Oregon, when winds blow in a southward direction, upwelling is enhanced, and surface temperatures fall (the red line).

Conversely, when winds blow to the north upwelling of cooler deeper water is inhibited causing temperatures to rise by 6-8C (14F).

Such dramatic natural temperature changes have nothing to do with radiative heating from the sun or greenhouse gases. Nonetheless warmer temperatures from reduced upwelling are often mistakenly incorporated into the global average temperature as seen during El Nino events and then attributed to CO2 warming.

It is far more insightful to understand climate change by looking at actual temperature changes. Using publicly available national weather service data, a quick survey of subarctic temperatures on January 29th, 2023, at 60 degrees latitude just south of the Arctic Circle, reveals how ocean currents alone cause tremendous temperature differences.


The Hudson Bay was -33C or minus 28F. Clearly any warming effects from greenhouse gases did not prevent such life threatening extreme cold. Such deadly cold temperatures evoke a much different concern for Hudson Bay inhabitants than NASA’s 2-degree warmer temperature anomaly, that laughingly is suggested as evidence of a global warming crisis.

Temperatures in the middle of the Labrador Sea jump 34 C or 60 F to a very livable temperature just below the freezing point.

Further east, higher Irminger Sea temperatures rise above freezing to 2.2 C or 36F.

And the Norwegian current is even warmer at 42F.

Benefitting from eastward winds that transfer ventilating heat from the warm Norwegian Current, the Norwegian coast reaches a balmy 7C or 44F in the dead of winter. Even though all measurements were taken at the same latitude, on the same date and same time, there is a huge 40C or 73F temperature difference between the Hudson Bay and Norwegian coast

Indisputably, that variability is caused by heat transported northward by ocean currents and ventilated to the Arctic atmosphere. It is the ocean currents that are the Arctic's climate control knob, not atmospheric greenhouse warming, as witnessed by the extremely cold Hudson Bay.


Indeed, a map of the warm and cold currents entering those subarctic seas, predicts precisely where temperatures would be warmest

The Norwegian current carries the warmest waters that originated in the Gulf Stream and North Atlantic Current.

A portion of the warm north Atlantic current that veered westward while ventilating some heat plus mixing with the cold east Greenland current keeps the Irminger Sea just above freezing but cooler than the Norwegian sea

Further ventilation of Atlantic heat and mixing with colder water lowers the observed Labrador Sea temperatures to just below freezing


NASA and a few other climate researchers have uncritically attributed declining winter sea ice to rising CO2 simply based on a negative correlation. Furthermore, by presenting the ice decline trend as a representation of all the Arctic and not a regional phenomenon, the National Snow and Ice Data Center's sea ice trend is a very misleading abstraction.

Their global warming correlation does not hold for 80% of Arctic winter sea ice extent.

Inside the Arctic Circle most of the winter sea ice extent has not been reduced, suggesting warmer air, purported to be derived from rising greenhouse gases, has yet to cause any change.


Furthermore, south of the Arctic Circle there is scant reduction for Bering Sea ice,

Nor is there any change in Hudson Bay winter ice extent. Of course, this is expected with winter temperatures hovering around -33C (-28F)

NSIDC graph of winter sea ice is driven by losses confined only to regions where warm Atlantic water intrudes, around the Norwegian sea, and more deeply into the Arctic Circle and the Barents Sea.

According to NSIDC, heat transported into the Arctic ocean has increased by 30% since 1900, making the variability of warm ocean currents the best explanation for the 20th century's ebb and flow of Arctic sea ice.

The cause of variable heat transport into the Arctic requires examining a complex of natural factors driving the great Ocean Conveyor Belt and its Atlantic segment, known as the meridional overturning circulation


The Atlantic is unique, in that warm water from the southern hemisphere crosses the equator and eventually reaches the Arctic.

Furthermore, the heating of water in the south Atlantic is partly controlled by the ocean Conveyor Belt's inflows from the tropical waters of the Pacific and Indian ocean. I won't discuss the circulation complexities of this segment any further here, except to share that La Nina conditions have a large impact. For those who want to understand the drivers of heating in those tropical waters, I suggest people view my previous video/blog on ocean heating "The Science of Solar Ponds Challenges the Climate Crisis".

Focusing on the Atlantic, research has determined 45% of the water passing through the Florida Strait and into the gulf stream originated from the south Atlantic.

Changes in the strength and location of Atlantic pressure systems and resulting ocean circulation determines how much heat enters the Arctic Circle or is recirculated southwards.

Unfortunately, most illustrations of the Ocean Conveyor Belt typically stop half-way up the Norwegian coast, but that is very misleading.


Warm Atlantic water circulates throughout the Arctic ocean and correctly predicts where Arctic temperatures will be the warmest.

The warmest temperatures are where Atlantic water first enters the Norwegian and Barents Sea, with ventilating ocean heat warming the air. Then slightly cooler Atlantic water continues to circulate through the 3 major Arctic basins beneath the thick sea ice.

A smaller volume of less warm water from the Pacific enters via the Bering strait

Whereas hardly any heat from intruding warm currents reaches the islands of the Canadian archipelago explaining the region's extreme cold.


Additionally, because the warm Atlantic water resides between 100- and 900-meter depths of the Arctic Ocean with a residence time of 25 to 30 years, any cyclical slowdown of the Gulf Stream may not be detected in Arctic Ocean temperatures or its sea ice extent for 2 to 3 decades

Again, we can observe how the pattern of intruding warm currents drives Arctic ocean temperature differences just inside the Arctic Circle at 70 degrees latitude.


Around Wrangel island where cool Pacific water enters via the Bering strait the temperature was -16.7 C or 1.9F.

However, where very little warm currents reach the islands of the Canadian archipelago, temperatures plummeted to -39C or -39F

For contrast, North Pole temperatures are 8C or 15F warmer than the archipelago due to Atlantic heat stored in the Arctic basins and ventilating through the ice. Partly due to such heating contrasts, Inuits hunting in the winter preferred to build their igloos on the ice instead of on land.

Temperatures over the southward out-flowing east Greenland current are -19C or -3 F in contrast to the temperatures of the adjacent inflowing Norwegian current that is 21C or 38F warmer.

Natural dynamics affect the flow of heat in the Atlantic segment of the Ocean Conveyor Belt. One dynamic is the location of the Intertropical Convergence Zone (or ITCZ) which caused a dramatic temperature effect at the end of the last ice age.


Ice core data show temperatures that had been rapidly warming suddenly dropped by 20C or 36F in the northern hemisphere for about a thousand years during a cold period called the Younger Dryas (YD). In contrast, southern hemisphere temperatures slightly warmed.

Proxy data suggests the westward trade winds and ITCZ had shifted southward causing the warm South Equatorial Current (SEC) to also shift southward. Brazil's eastern most land, Ponta do Seixas amplified that shift by deflecting more warm water back into the south Atlantic and thus cooling the north Atlantic.


The warmer 10,000 years of the Holocene period correlates with the ITCZ shifting northward, causing the warm South Equatorial Current to deliver more warm water across the equator, to warm the north Atlantic while cooling the south.

A similar but smaller southward shift of the ITCZ corresponds with the Little Ice Age which mostly cooled the northern Atlantic regions. The Little Ice Age ended around 1850 as the ITCZ moved northward for our most recent 150 years.


Like the drivers that caused and ended the Younger Dryas, the Atlantic Multidecadal Variability or Multidecadal Oscillation, represents 20+ years of warmer temperatures in the north Atlantic than the south and then reversing. This oscillation is intimately linked to variability of the surface currents in the Atlantic’s surface Meridional Overturning circulation within the Ocean Conveyor Belt.

First detected in the 1980s and officially named around 2000, the positive phase represents a warmer north Atlantic that is linked to several climate dynamics. From the 1930s to 60s and then 1990s to present, the positive warm phases were associated with less Arctic sea ice, increased Sahel rainfall, increased hurricane activity, and frequent heat extremes in the southwestern USA.


The negative phase from the 1960s to 1990 (represented in blue), saw a reversal of those dynamics as Arctic sea ice rebounded from its 1930s low extent. Accordingly, a 40-year research project over the Arctic ocean during a cool phase and published in 1993 determined there was an "absence of evidence for greenhouse warming" over the Arctic ocean.

So, for your sake, please understand these natural oscillations. Knowledge protects you from fear mongering politicians who blame loss of Arctic sea ice on the car you drive or that you like cooking with a gas stove.


There 3 guidelines to consider preventing being victimized by their climate misinformation.

First consider all the science, an abundance of researchers reports warming dynamics other than CO2. Science is a process, and nothing is settled yet.

Second become well acquainted with natural climate change. Natural climate change serves as the baseline, or the control data, from which to accurately judge the effects of CO2 emissions. The purpose of my series of climate videos and blogs is to provide a better understanding of the science of natural climate change to the public.

And finally, embrace renowned scientist Thomas Huxley’s advice: "skepticism is the highest of duties and blind faith the one unpardonable sin".


Thanks for watching!

Thursday, January 5, 2023

The Science of Solar Ponds Challenges the Climate Crisis


This is the transcript to the video at https://youtu.be/wl3_YQ_Vufo

Welcome everyone.

Today I want to demonstrate how the science of solar ponds can provide useful inexpensive heating, without the need for exotic materials. Furthermore, an understanding the science of solar pond heating will profoundly change how you view climate crisis narratives. Despite air temperatures averaging 68F, solar ponds can fantastically almost triple temperatures in their bottom layer to over 190F.

There are 2 major ways to raise a solar ponds' temperature:

Radiative heating and Dynamical heating.

Radiative heating, increases the amount of light energy. Sunny days raise temperatures more than cloudy days. But high solar pond temperatures can peak without any change radiative heating due to dynamical heating. Dynamical heating happens by suppressing convection & cooling, so that heat accumulates and drives very high temperatures.

Solar pond dynamical heating suppresses cooling by creating a density gradient, with fresh water at the surface and dense salt water at the bottom. Because the dense salty bottom water is heavier, it doesn't rise to the surface, despite warming to 190F.

Bottom layer heat can only ventilate via its micron thick skin surface. Unable to rise to the skin surface, heat rapidly accumulates in the bottom layer.

Solar pond science is based primarily on an 8th grade understanding that things less dense than water will float and denser things will sink.


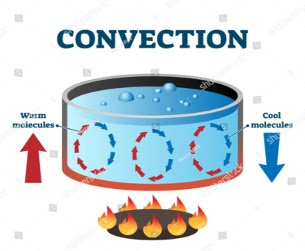
A pot of water on your stove first heats the bottom layer. Heating makes the bottom layer expand and become less dense. That causes a convection current with the warmer water rising and cooler denser water from the top sinking.

But that dynamic doesn’t happen in a salt pond, because the bottom water's high salt concentrations overcome any heating effect.

Typical density demonstrations for 8th grade science use colored water to visualize salinity effects and are available online. For example, on the left side of the container, the yellow water is fresh. The blue-green water with added salt, here measured at 35 parts per thousand, was added but immediately sank below the fresh water. To continue the demonstration, green water separated on the right side had only half the salt, 17 ppt. When the separator was removed, that water inserted between the fresher and denser layers.


Adults have embraced this science, making layered cocktails using liqueurs with different densities, such as this Patriot drink for the 4th of July. Hopefully, adults can extend that understanding to better understand our changing climate.

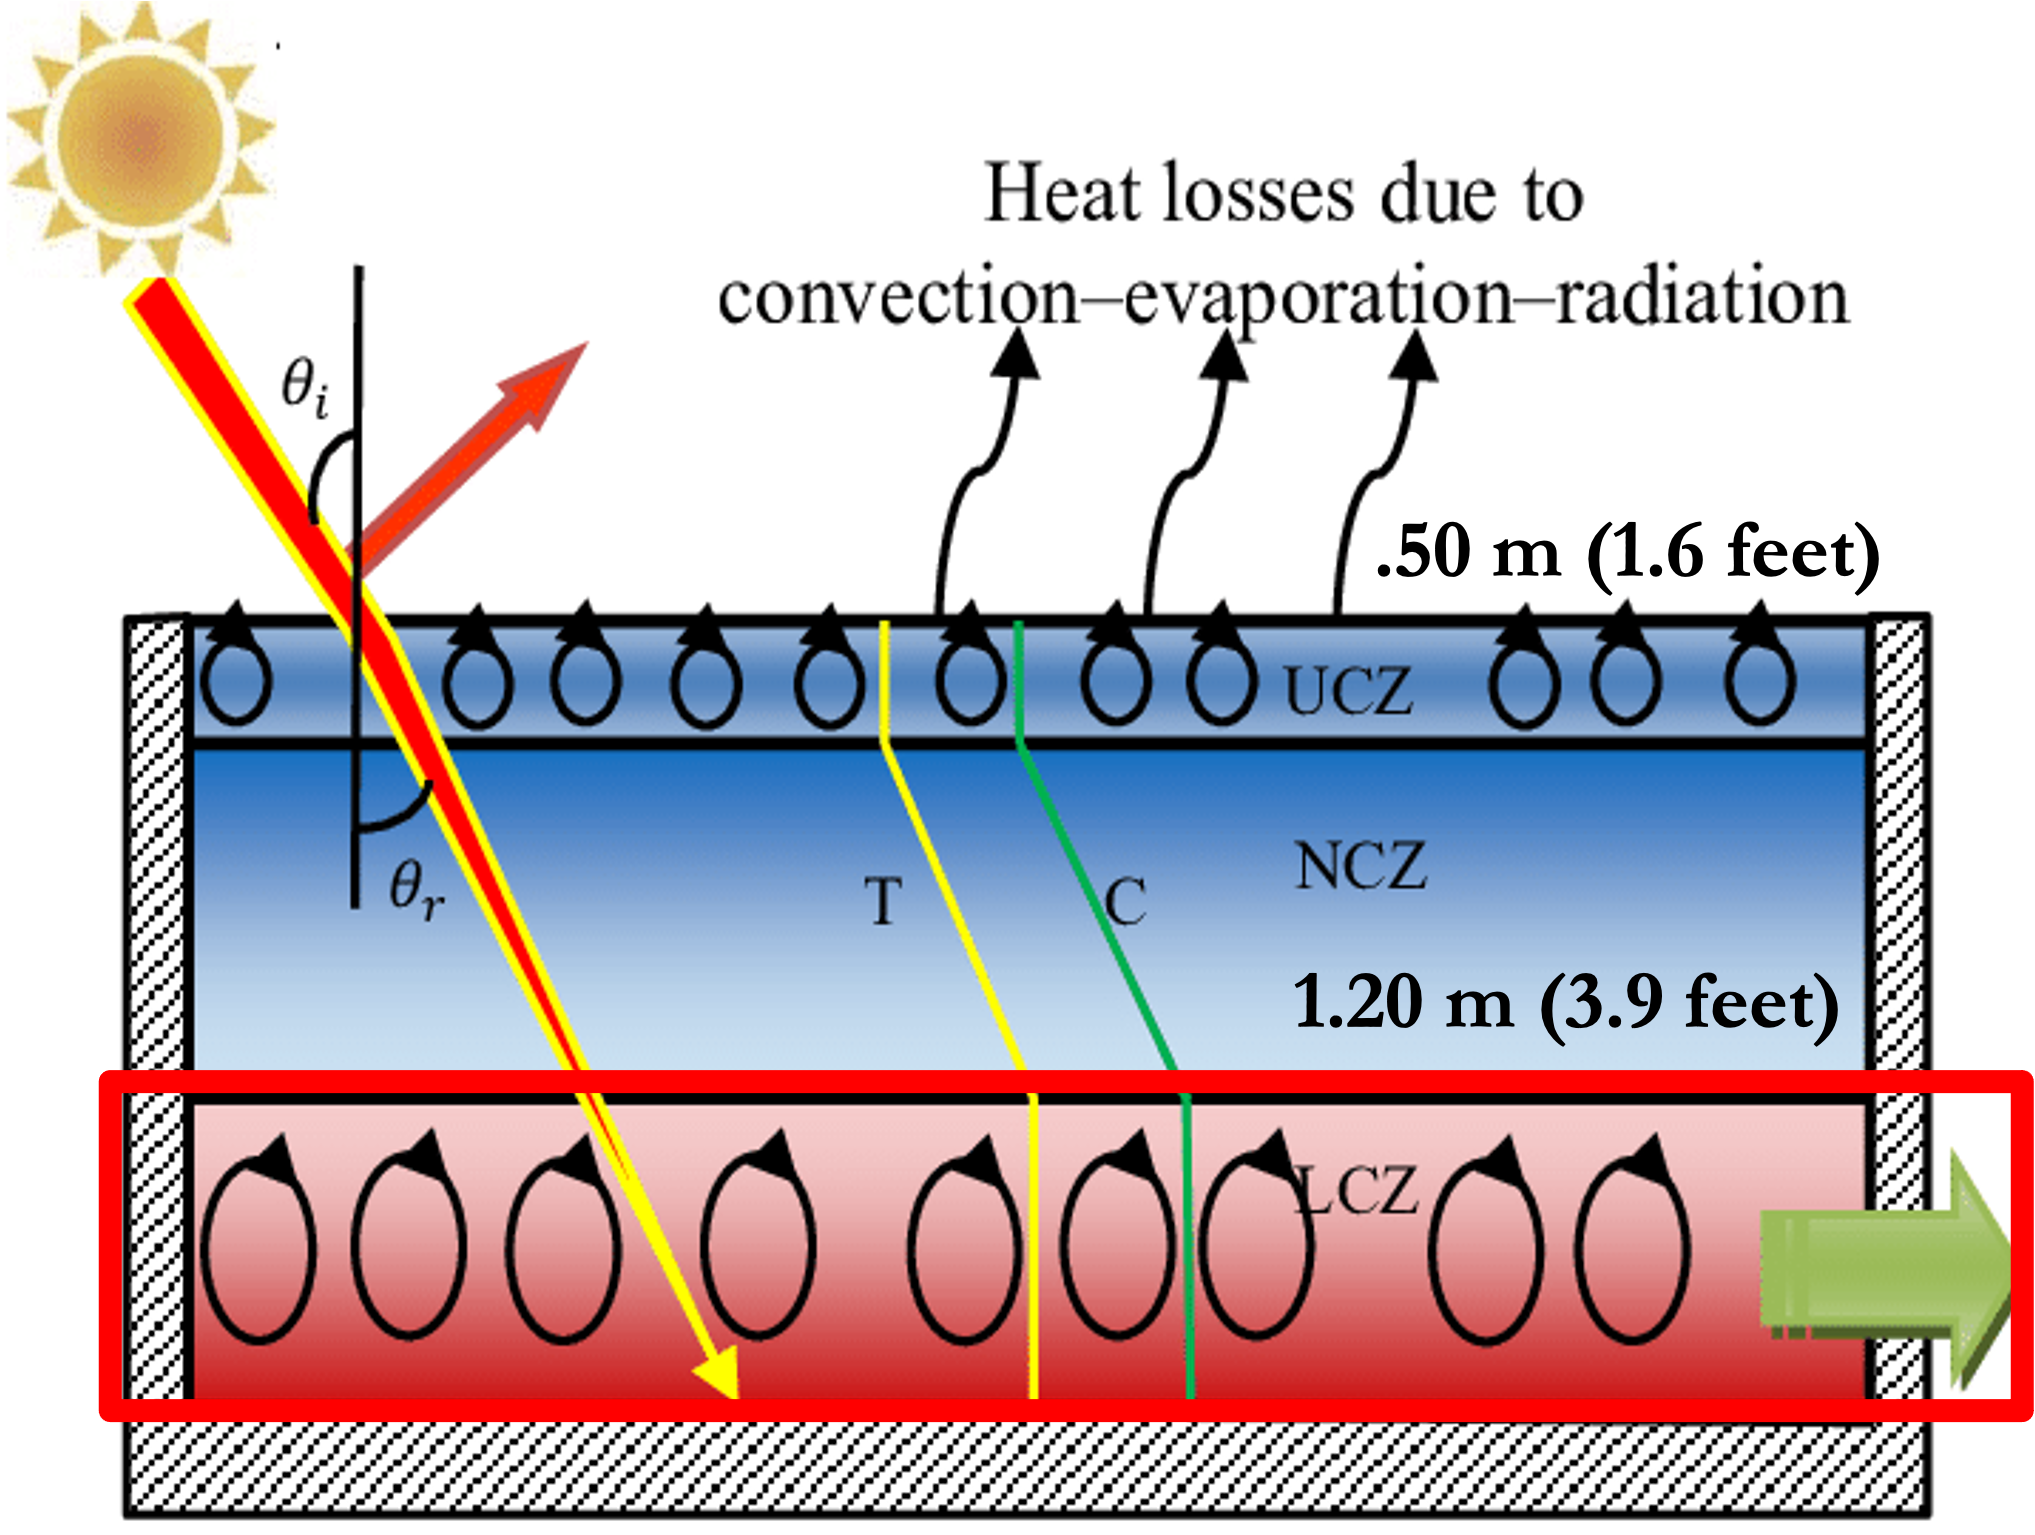
Here's a closer look at salt pond dynamics. Ponds are typically just 10.5 feet deep. An upper layer of fresh water must be maintained at a depth of 1.6 feet. Temperatures in this layer never get hot enough to be useful as it is constantly cooled by radiating heat away or by losing it via evaporation and contact with the air.


The pond's bottom half is nearly 5 feet thick and saturated with salt. That water is too dense to rise and mix with the fresh surface layer. So unable to convect upwards and cool, the heat accumulates.

The trapped hotter bottom water is then circulated to heat a building or a greenhouse. Or the near boiling temperatures can drive turbines that generate electricity. Although solar ponds can never solve all our energy needs, the most promising environmental application is desalinization. Ocean water provides an endless cheap supply of salty water. Producing fresh water for desalinization reduces water withdrawal from our streams and rivers, thus benefitting aquatic animals. Desalinization would also reduce ground water withdrawals that have caused many coastal cities to sink closer to and below sea level.


The same dynamical heating seen in solar ponds is ubiquitous throughout nature. Antarctica's Lake Vanda (highlighted by red rectangle and red dot in upper left), provides a testimonial to the power of dynamical heating. Despite brutal sub-freezing air temperatures averaging from -22F to 5 F, heat accumulates in its bottom layers and reaches room temperature, 70F.


That amplification of solar heating is more amazing when you consider Lake Vanda receives very little sunshine for half the year, receiving just 40% of the sunshine entering tropical waters. Furthermore, the sunlight that reaches the bottom layers is minimal, being at the depth limit of sunlight penetration.

Nor does greenhouse warming from CO2 contribute at all. Researchers have shown Antarctica gets so cold, that uniquely, greenhouse gases there have a cooling effect. Like the bottom layer of a salt pond, it is the salty bottom layer of Lake Vanda that accumulates heat.

Although short wave energy from the sun and longwave energy from greenhouse gases are all measured in W/m2, they affect water very differently! (For those unfamiliar with Watts, it is simply a measure of energy per second. More Watts simply indicate more energy). Using 260 W/m2 as the average shortwave solar energy entering the water, the uppermost layers absorb the most energy. Without a salinity effect the upper layers are the warmest. Solar penetration then declines with depth. In completely clear water, absorbed solar energy is reduced to near zero at a 100 meters depth.


The added red line approximates the typical solar pond depth of 10.5 feet. At that depth, enough heat is absorbed and accumulates quickly enough for efficient practical use of its heat, by raising temperatures to over 180F. Deeper ponds are avoided because as solar penetration declines, the average bottom temperatures also decline making it less efficient for any practical use.


The generalized temperature gradient in lakes and oceans is just the opposite of what is observed in solar ponds, or Lake Vanda or everywhere there is a salinity effect. Without a salty layer to trap subsurface heat, upper layers are always warmer than deeper layers. The upper layer can have a uniform temperature because the winds and convection constantly mix the water. Below 200 meters, the deep water uniformly averages 39°F (4°C)

However, the mixed layer's temperature is not completely uniform. The skin layer is almost always cooler than the warmer mixed layer below. The skin layer averages just a few microns deep. But any heat absorbed in the mixed layer of the ocean, or a salt pond, can only escape via that very shallow skin layer. The skin layer is cooler because it is constantly losing heat to the atmosphere.


The mixed layer is warmer because its heated water must first rise next to the skin layer, where heat is slowly transported via conduction and warms the skin layer. Only then can the mixed layer's absorbed solar heat be radiated away or be lost via evaporative cooling. That delay in cooling causes a daily temperature cycle with a warm solar-heated diurnal layer that cools during the night. Similarly deeper waters will accumulate heat during the summer and ventilate it during the winter.

In contrast to deep solar heating, longwave greenhouse energy behaves very differently. Although greenhouse energy supplies nearly twice the energy to the skin layer, that energy does not penetrate any deeper than a few microns. Thus, unlike the delayed cooling of deeper layers, absorbed greenhouse heat can be radiated back to space immediately.


A 2018 ocean study measured 410 W/m2 of greenhouse longwave energy entering the ocean's skin surface, while simultaneously the skin surface radiated away 470 W/m2. The skin layer almost immediately radiated the 410 W/m2 of greenhouse heat back to space plus an additional 60 W/m2 of radiation from the rising solar-heated layers. In addition, the skin surface lost latent heat (LH) via evaporation and sensible heat (SH) via contact with the atmosphere.

Like the dense salty layers of a solar pond that trap and accumulate heat, oceans naturally have salty Barrier Layers, trapping heat that affects climate and extreme weather. Ocean "Barrier Layers" were first detected just 30 years ago, but since then 100s of studies point out the importance Barrier Layer heating and the need for such dynamical heating to be included more realistically in global climate models.


While this 1992 diagram may seem a bit confusing at first glance, the science of a Barrier Layer isn't much more complex than concepts taught in 8th grade.

The black line shows how measured temperatures change with depth. The blue line shows salinity changes and the red line shows density changes. Based on density, in this study the ocean's upper 40 meters represents the ocean's well "mixed layer" where temperature and salinity are homogeneous.

The middle layer highlighted in orange, is the Barrier Layer between 40 & 80 meters depth. Despite declining solar penetration, the Barrier Layer contains warm water similar to the upper mixed layer. Below the Barrier Layer is the colder thermocline where temperatures rapidly cool as solar penetration declines.

The increasing salinity and density of the Barrier Layer minimizes both any upward mixing of colder thermocline waters while trapping heat much longer than possible in the mixed layer. Barrier Layers are often detected because that trapped heat raises temperature higher than the upper mixed layers.


Several studies have recently shown that understanding ocean Barrier Layers provides valuable knowledge for predicting intense deadly hurricanes and cyclones. Without a Barrier Layer, hurricanes rapidly pull cool thermocline waters into the mixed layer, weakening the heat supply that drives the storms. In contrast, a thick Barrier Layer helps a storm maintain its intensity by inhibiting that upward circulation of cooler water.

In contrast to media fear mongering, the international disaster database, shows climate-related deaths since the 1920s have plummeted from nearly 250 per million to less than 10. Our increasing ability to predict and prepare for devastating storms has largely been responsible for this success. And our increasing understanding of the effects of Barrier Layers is improving that knowledge.


Also, as illustrated by this study in England, the number of deaths, (represented by the vertical bars) increase, as temperatures decrease (represented by the curves). Peak deaths correlate with the coldest temperatures from December through February. The good news is, there is reason to believe that any accumulation of heat in our oceans' Barrier Layers could drive warmer & milder temperatures and reduce winter deaths.

The Pacific Warm Pool is the earth’s greatest example of a natural solar pond. The warm pool contains the earth's warmest body of ocean water averaging between 82F and 90F. Because the warm pool generates the earth's greatest amount of heat and moisture which then gets transported across the world and affects global climates, it is nicknamed the "earth's climate heat engine". The warm pool has been increasing since the end of the Little Ice Age, correlated with our 150 years of global warming. Warm pool warmth has also sustained the greatest diversity and abundance of coral reefs, giving the region another nickname "the Coral Triangle".


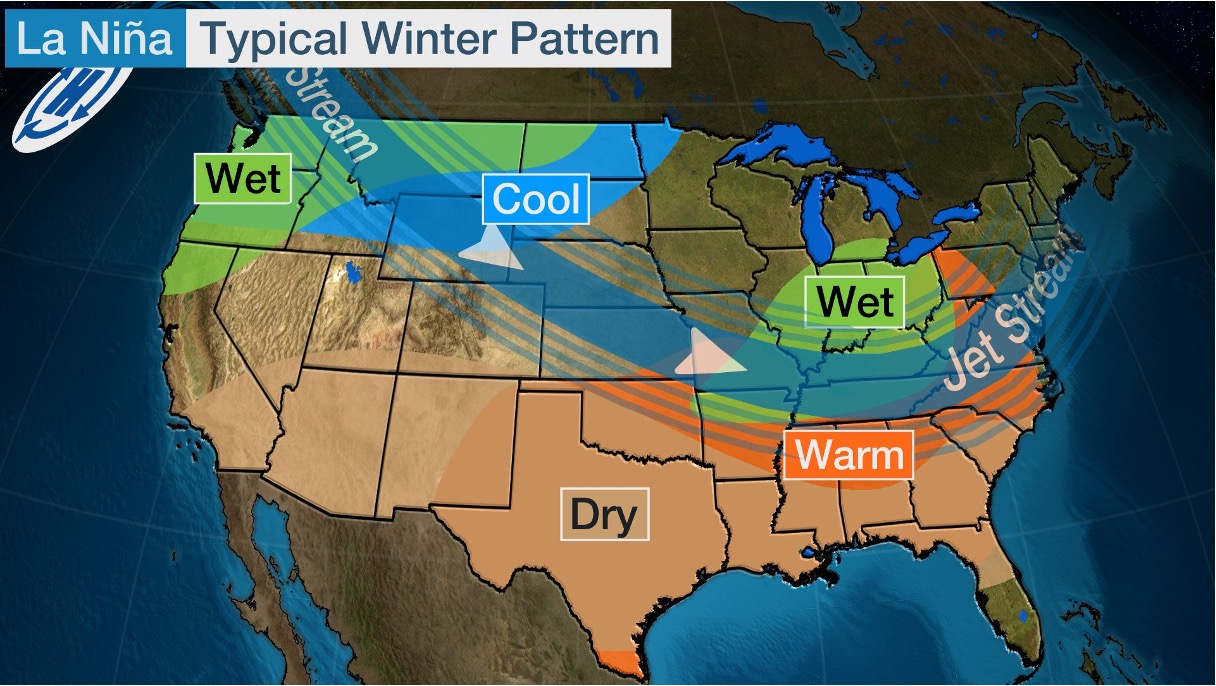
The size of the warm pool and its stored heat increases during La Nina-like conditions, and La Nina-like conditions have predominated over the past 150 years. During La Nina -like conditions the trade winds remove surface water heated in the eastern Pacific and sweeps it westward to the warm pool. There, with the assistance of a strong Barrier Layer, heat is stored as deep as 200 meters.

The removal of warm surface water results in a cooler eastern Pacific which reduces cloud cover. That increases solar heating and increases evaporation, producing saltier surface waters.


The red regions here represent the areas where ocean evaporation exceeds precipitation, increasing surface salinity. The trade winds then transport that warm salty water westward, where the higher salinity drives dynamical heating of the warm pool.

The warm pool's freshwater layer, required to create a natural solar pond, is provided by the Intertropical Convergence Zone, or ITCZ. The ITCZ produces 32% of all global rainfall.

In this December 28th, 2022, screen shot from a national weather service model, the lighter blue represents the regions with the most rainfall, and ITCZ’s location. The observed heaviest rainfall over the warm pool completes the conditions needed to accumulate the warm pool heat that powers our earth's heat engine. Despite solar pond dynamics, warm pool temperatures never reach the extreme levels observed in solar ponds.


Three major dynamics prevent such extreme warming. First, warmer ocean temperatures enable more intense atmospheric convection that removes heat via evaporation. The second factor is an El Nino. During an El Nino the warm water stored deeply in the warm pool migrates eastward towards the Americas. That brings deeply stored warm water closer to the surface where it can now ventilate and shifts heavy rainfall to the eastern Pacific.

During each El Nino event (represented here by the red arrows), the ventilation of stored ocean heat confusingly raises the global air temperature. The media incorrectly attributes such warmer air temperatures to global warming. But counter-intuitively the earth is really cooling because heat that had been stored in the warm pool for years is now being ventilated back to space.


Long term changes in the Pacific Warm Pool over thousands of years provide scientists with critical information about the most important factors controlling the world's heat engine and thus our weather today.

During the Holocene Optimum around 10,000 to 8,000 years ago, the thermocline at the bottom of the warm pool, was over 1F warmer than today. Since that time, its temperature has steadily declined. In contrast, most climate models erroneously simulate steadily rising temperatures in the warm pool over the past 10,000 years.


These modeling failures largely happen when warm pool temperatures are incorrectly assumed to be driven by rising CO2. Unfortunately, dynamical heating by the warm pool's Barrier Layers is not well modeled.

Ice cores find that CO2concentrations were at a low point 10,000 years ago and have increased throughout the Holocene. Despite all the evidence that the warm pool cooled while CO2 concentrations increased, insufficient climate models still suggest that rising CO2 will cause catastrophic ocean warming.

The declining Holocene warm pool temperatures are better explained by increasing El Nino events. 10,000 years ago, El Nino events were more rare and most researchers suggest the Pacific ocean was predominantly in a La Nina-like state. (Note that the timeline direction is reversed in this graph).


Changes in the sun's strength have also played a role. Based on carbon-14 dating, the coldest period of the Holocene, the Little Ice Age, coincides with a weaker sun and sunspot minimums. Despite higher CO2 concentrations than the Holocene Optimum, during the Little Ice Age, Arctic sea ice reached both its greatest extent and thickness in 10,000 years.

Most researchers have determined the Pacific Ocean was in an El Nino -like state during the little ice age. Although slightly lower solar output during sunspot minimums, would only slightly weaken radiative heating, lower solar heating does weaken the trade winds causing a much greater effect on dynamical heating of the warm pool.


Extreme warm pool temperatures are also prevented because its accumulated heat is constantly exported. The pathways of warm ocean currents emanating from the tropics and moving towards the poles are illustrated here in pink.

Satellite data reveal where more heat enters the ocean than leaves (shown in red). The location of the greatest heat entering the ocean is consistent with La Nina like conditions. Regions shown in blue represent regions where exported tropical heat is ventilated and warms the air in that region, warmer than local radiative heat would.


I'll end here with an extreme example demonstrating the enormous impact of exported heat from ocean warm pools and its effect on the earth's climate. When antarctica was part of a single continent called Pangea, Antarctica was insulated from ocean currents, and accordingly much of Antarctica was glaciated. During the Cretaceous period, 94 million years ago, the continents were separating, allowing warm waters from the tropics to reach Antarctica. Despite being centered over the south pole, warm ocean currents promoted a warm Antarctic climate where dinosaurs thrived. Thick coal producing forests survived after the dinosaur extinctions.


As the continents continued to spread, about 35 million years ago, Antarctica became an island surrounded by the Antarctic Circum-polar Current, and once again tropical heat was blocked from reaching Antarctica.

As a result, despite CO2 concentrations 4 times higher than today, glaciers began forming in Antarctica, and Antarctica has continued to became so cold that only one vertebrate species, the Emperor Penguin, can survive its winter.


So before adopting bizarre solutions by egomaniacs like Bill Gates, who is working to block the sun and cool the planet, please examine all the science.


Likewise before believing, we are plunging into a human-caused climate crisis, please ask:

  • How does radiative and dynamical heating increase warm pool temperatures?

  • How does greenhouse energy possibly heat below the skin surface?

  • How does exported heat from warm pools affect our climate and what are the contributions of natural La Nina and El Nino-like conditions.

If you follow all the science undeniably affecting our climate, you just might sleep better tonight knowing there is no climate crisis.


Our democracy depends on a diverse array of good critical thinkers. So, please shun mindless group think. Instead embrace renowned scientist, Thomas Huxley’s advice:

“Skepticism is the highest of duties and blind faith the one unpardonable sin.”

so if you appreciate the science clearly presented here, science rarely presented by mainstream media then please click the like button, share and subscribe to this channel and leave a comment