Translate

Wednesday, April 5, 2023

Global Warming Greenhouse Theory’s Greatest Weakness


Global Warming Greenhouse Theory’s Greatest Weakness

This is the transcript for the video at https://youtu.be/XHLafd2MU-k


Welcome back everyone.

How long heat gets trapped near the earth's surface determines the global temperature, but the lack of adequately measuring this time delay is the greatest weakness in global warming theories.

The public often gets the wrong impression of the greenhouse effect from illustrations like this suggesting CO2 is trapping heat forever.


A comparison of the time delayed cooling by 3 different mechanisms of trapping heat, calls into question how each mechanism contributes to global temperatures and extreme weather. Other heat trapping mechanism by sea ice, clouds, or urban surfaces, won’t be discussed. Now undeniably, greenhouse gases delay the escape of infrared radiation back to outer space. .

In contrast heat domes that produce heat waves don’t trap radiation but suppresses the normal convection process that normally carries heated air away from the surface for days and even months.

The ocean's salty sub-surface layers also suppress ocean convection, trapping ocean heat for days, seasons, and years. And that trapped heat intensifies hurricanes and typhoons.

In one of the 20th century's most influential books "the structure of scientific revolutions, Thomas Kuhn wrote “philosophers of science have repeatedly demonstrated that more than one theoretical construction can be placed upon a given collection of data.” Kuhn was advising us to be careful and distinguish good data from the opinions claiming the data supports their pet theory.

This illustration graphicly represents the collection of data describing how the energy absorbed by the sun each day escapes back to space via waves of long wave radiation. It is solid, undisputed science based on theory and observations from satellites and laboratory experiments. It is the foundation of greenhouse theory upon which opinions regarding various climate crisis theories have been constructed.


The laws of physics have theoretically determined "how much" energy each infrared wavelength should transport back to outer space, for a given surface temperature if, there was no atmospheric interference. This is represented by the blue curve.

For non-physicists, it is helpful, to think of infrared wavelengths as roadways carrying solar heat from the earth back to space. Wavelengths between 20 and 15 microns should act like interstate highways carrying the greatest flow of heat,

While wavelengths of 5 or 40 microns act like dirt paths allowing very little heat transport.

The black jagged line represents how much energy each wavelength is actually transporting back to space as observed by satellites.

The difference between the blue and black curves represents an undeniable greenhouse effect. This is all excellent data and settled science.

But beware! This data does not determine for how long infrared heat will be trapped. Greenhouse gases only serve as detours, not permanent traps. Those detours simply delay the time needed for heat to escape to space. Not understanding this crucial point, has led to many absurd theories of a climate crisis, mass extinctions and much weeping and gnashing of teeth.

CO2 is a powerful greenhouse because it absorbs wavelengths centered around 15 microns that serve as major interstate highways for heat escape. CO2 forces half the theoretical heat to take a detour.

CO2 emits any absorbed heat in less than a second and emits those wavelengths in all directions with half re-directed back to the earth's surface. It is this redirected heat that is believed to warm the surface.

In this illustration the green line separates absorption by CO2 from absorption by water vapor. The red line shows that by doubling CO2, it only increases the amount of re-directed heat by 1%.

Water vapor absorbs much more heat from a wider range of wavelengths. Dry desert climates lacking water vapor experience a reduced greenhouse effect. Heat can escape more freely so that nighttime temperatures rapidly plummet by 50 to 100 degrees Fahrenheit, despite a remaining CO2 effect.

More importantly, there are also wavelengths that always escape freely to space, providing an atmospheric window that allows about 15 to 20% of the earth's energy to escape without delay. That window also provides the escape detour for re-directed greenhouse heat.

Although the redirected energy is transported by specific wavelengths of water vapor and CO2. It has a more general effect. A warmer surface now emits the entire spectrum of wavelengths.

So, 20% of CO2's redirected energy now escapes freely through the atmospheric windows counter-acting the warming. That process repeats and continues throughout the night dropping surface temperatures lower and lower, back to their early morning minimums. So, despite added energy, the greenhouse effect doesn’t trap heat for very long.

Extreme heatwaves caused by heat domes operate in a manner like a car with its windows raised. It doesn’t matter how heat is radiating back to space, but for how long warm air is trapped close to the surface.


The longer the windows are up during midday sunshine, the higher the temperatures rise. At midday in 80F heat, temperatures inside your car can rise by 43 degrees to 123F in just one hour. Tragically, not realizing how quickly heat can accumulate, pets and children left in cars can die.

To reach 123 degrees Fahrenheit, the car's rate of energy gain was at least 154 W/m2 for a full hour (FYI a watt is a measure of energy per second). Increased CO2 only adds about 2 W/m2, so it would be silly to argue that rising CO2 made the car hotter, when just lowering the windows would eliminate the extreme temperatures. The important dynamic for people to understand is suppressed convection causes extreme temperatures.

The ground, heated by solar radiation, sheds that heat in 3 ways: by emitting a spectrum of longwave radiation, by cooler air absorbing heat when contacting the ground, and by convection that carries the heated air towards the stratosphere. Without convection, the earth's surface would trap surface heat like the car with its raised windows.

Convection not only causes warmer air to rise but allows cooler air from higher altitudes to sink. The mixing of cooler air further reduces surface air temperatures.


Carrying warm air up to the stratosphere is also crucial for cooling. You can see where the stratosphere begins when a rising rain cloud flattens out as it reaches an altitude where the stratosphere begins, called the tropopause. At that altitude, the air is about 100F (64C) cooler than the ground. The air has cooled due to both lower air pressure and by radiating heat back to space.


However, if the air doesn’t radiate heat away, cool air would simply warm back to its original temperature as it sinks. So, how does 99% of the air molecules that are not greenhouse gases, mostly oxygen and nitrogen, radiate away the heat they absorbed from contacting the ground?

C02's warming effect is greatest at low altitudes where it is largely saturated. So future increases of CO2 will have a smaller and smaller warming effect.

Unfortunately, click-bait media rarely informs the public that CO2 also has a strong cooling effect increasing emissions in the stratosphere and mesosphere. Satellites observe that the stratosphere is cooling twice as fast as the lower atmosphere is warming.


Warmed oxygen and nitrogen can shed their heat by colliding with CO2 and transferring its heat. So, CO2 can then radiate their heat away.

In contrast, heat waves are caused by suppressed convection in the lowest 6 kilometers of the atmosphere that prevents rising air from reaching the stratosphere and cooling radiatively. Heat domes trap heat for days. They are high pressure systems where sinking air inhibits convection and reduces cloud cover which also increases solar heating.


Canada's record high temperature was set and reset 3 days in a row at the end of June 2021 in Lytton, British Columbia. The final record was 45F (25C) warmer than the average maximum temperature for June. A difference that's intriguingly like the increased temperature of the car with its raised windows.

Southwestern Canada’s heat wave was caused by an exaggerated ridge in the jet stream known as an omega block. Omega blocks regularly cause high-pressure systems that linger in one location. As the block remained in place for days, more heat accumulated each day driving Canada’s record temperature higher and higher.


Click-bait media, like CNN clearly doesn’t know its geography. They ranted that this very local heat dome was evidence that "climate change is frying the whole northern hemisphere."

However, science doesn’t support CNN’s rants as climate models all suggest any warming "should reduce such blocking events."


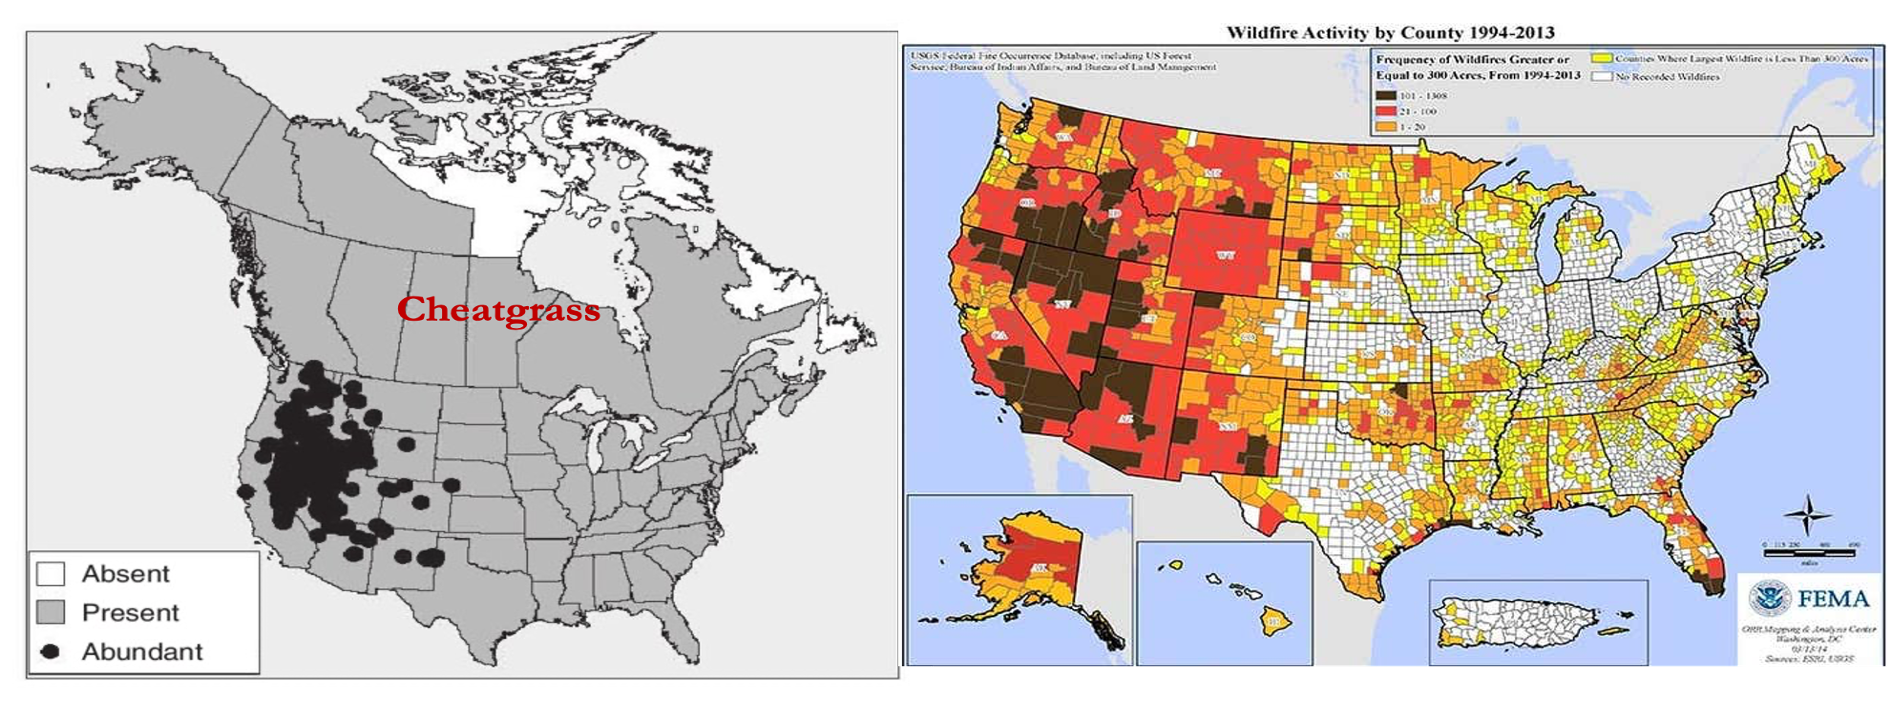
Finally, if we also consider that the dryness accompanying most heatwaves reduces the normal greenhouse effect, plus the absolute lack of any correlation between heat waves and rising CO2 as seen in this EPA graphic, it suggests that all the hype by politicians and the media ranting heat waves are evidence of a CO2 driven climate crisis, is just unsubstantiated fear mongering.


Lastly, suppressed convection also warms the oceans causing layers of trapped heat that can warm the air and intensify hurricanes and typhoons. There is a scientific consensus that no matter at what depth heat is absorbed, it is trapped in the ocean until it rises to the micron-thick skin surface, the only place ocean heat can escape.

However, when there is a salinity gradient with fresher water at the surface and saltier water below, despite being warmer, the denser saltier water suppresses convection, preventing it from reaching the skin surface to cool.

Humans have taken advantage of that salinity effect by creating solar ponds that generate useful heat to warm buildings and greenhouses or generate electricity. Solar ponds maintain a bottom layer of dense salty water at about a 6 to 10-foot depth where solar heating is greatest. Those dense layers trap penetrating solar heat, raising the bottom layer temperature to as high as to 190F (88C) despite air temperatures of only 68F (20C).


Similarly, salinity gradients in the ocean trap heat in subsurface layers maintaining warmer ocean temperatures from the tropics to the arctic.

Surveys in tropical oceans observed that the upper 20 to 40 meters will usually be well mixed by the winds and currents. So that layer has similar salinity, represented here by the blue line.

As well as similar temperatures represented by the black line.


But between 40 and 60-meters depth, increased salinity trapped solar energy and slightly increased temperatures where we would otherwise expect cooler temperatures due to declining solar penetration. Oceanographers call this layer the "barrier layer" because it stores heat and prevents colder deeper water from mixing with the surface layer, thus making surface temperatures warmer.

In contrast to the solar-salinity heating effect, there is no obvious mechanism demonstrating how greenhouse infrared might warm a solar pond or the ocean. All infrared energy re-directed towards the surface by greenhouse gases never penetrates deeper than a very few microns into the ocean's skin surface layer.


A recent tropical ocean study measured 410 watts of greenhouse infrared energy penetrating a few microns into the cool skin surface.

However, the cool skin surface immediately radiates away all the heat that reaches that layer. In this study the heat emitted from the skin layer accounted for all the infrared heat from the atmosphere plus any solar heated subsurface water that had risen by convection and conduction to the skin layer.

Solar heated water requires more time to reach the skin surface and ventilate. Thus, it is most likely that any ocean warming is driven by trapped solar heat that is mixed downward.

There are well studied natural mechanisms demonstrating how oceans create and maintain salinity gradients that trap subsurface solar heat. In the simplest of terms, regional differences in evaporation and precipitation produce the required salinity gradient.


Atmospheric circulation, the Hadley Circulation, creates regions of descending air and high pressure that generate clear skies, greater solar heating as happens in heat waves and high rates of evaporation with very little rainfall. Saltier water is produced there.

As illustrated by the red regions, these so-called ocean deserts happen at the same latitudes where the atmospheric Hadley Circulation maintains deserts on land.


The trade winds then blow that saltier water towards the equator and westward.

The trade winds also blow the evaporated water vapor towards the equator where it converges, then rises and produces the world’s greatest region of rainfall around the equator, here represented in blue, and named the Intertropical Convergence Zone. The copious rainfall maintains the salinity gradient with fresh water on top of the warm saltier water. These combined dynamics constantly provide the needed ingredients to produce permanent heat trapping barrier layers.


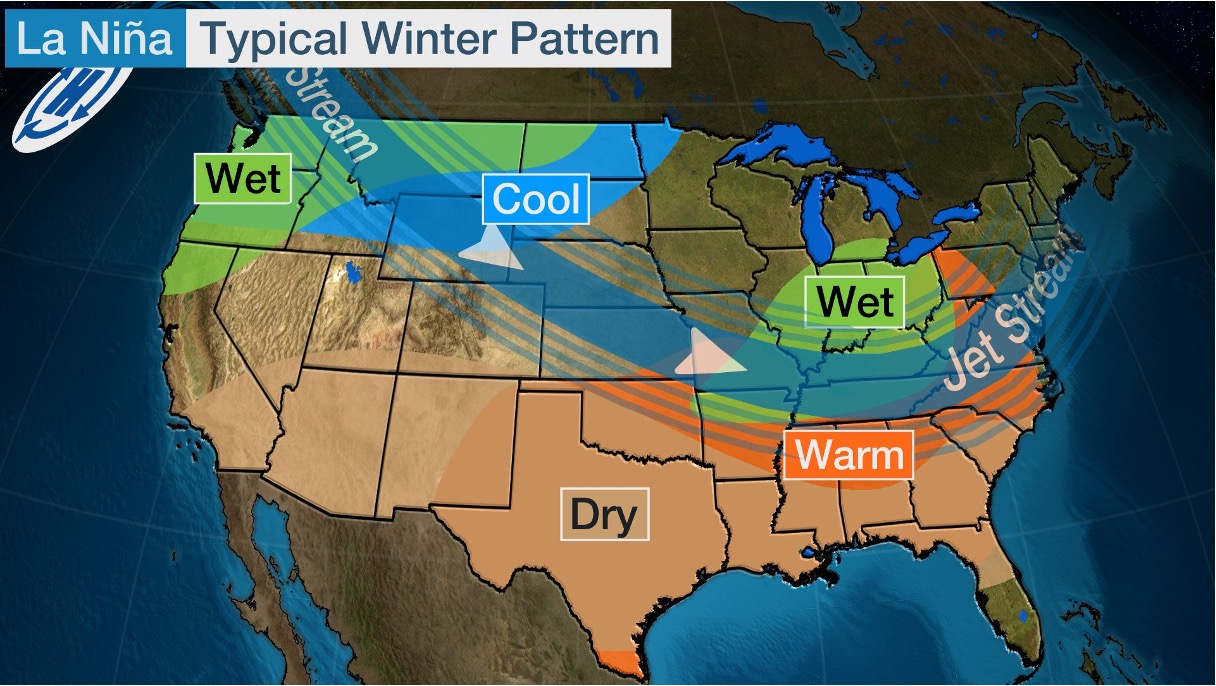
This "solar pond" heat trapping mechanism forms the earth's greatest reservoir of heat, the western pacific warm pool, which stores solar heated water as deep as 200 meters. The warm pool grows during La-Nina like conditions and shrinks when an El Nino event ventilates that heat.

During La Nina-like conditions, the amplified trade winds blow the warm salty water into the western pacific warm pool.

Simultaneously, colder deep water upwells in the eastern pacific, permitting a high-pressure system to form that amplifies the trade winds and creates clearer skies and greater solar heating.

As a result, the eastern Pacific and eastern Atlantic, illustrated here by the blue regions,


Absorb and trap more solar heat than any other regions on earth. That stored heat is eventually transported around the world where it ventilates and warms the atmosphere.

The regions illustrated in red represent where the most of that trapped heat ventilates, warming those latitudes several degrees higher than possible if there was no ventilated heat.

For example, heat ventilating from the Gulf Stream is why western Europe’s winters are milder than similar latitudes in North America by 27-36F  (15-20C).

These dynamics contribute to the recent 150-year global warming trend as the tropical Pacific’s predominant El Nino-like condition during the little ice age switched to a predominant heat-absorbing La Nina-like conditions this past century. Intriguingly, based on scientific estimates of the speed of the global conveyor belt's transport, heat now ventilating in the arctic and reducing sea ice may have first been trapped in the Pacific Ocean 200 years ago.

It is also the trapped heat in tropical warm pools that enables tropical storms to evolve into hurricanes.


And the pacific warm pool with its more permanent barrier layers enables hurricanes with the most intense wind speeds designated as category-5 hurricanes, to develop.

Uniquely, in the tropical south Atlantic, hurricanes virtually never form because waters heated in the tropical south Atlantic circulate across the equator and get stored in the north Atlantic warm pool.

In 2005 three category 5 hurricanes struck the United States prompting a flurry of click-bait media headlines proclaiming global warming was making more fierce hurricanes that also "intensify more rapidly", thus rising CO2 will continue to make hurricanes more deadly.

But examining the different 2005 storm tracks of hurricane Wilma or hurricane Katrina reveals those 2005 hurricanes only reached a "fierce" category 5 status for a very short time and over just a very small local area and not when making landfall. Thus, it is regional ocean warming that is much more likely to be the cause of any intensification bouts. Not global warming.


Political fear mongers do not hesitate to weaponize the societal damage and human grief caused by hurricanes, so they cherry-pick the brief category 5 stints to blame rising CO2, while ignoring the dynamics causing hurricanes to exist for most of their lifetime in much weaker conditions.

Fortunately, mother nature quickly counter-acted the blatant fear mongering. For the next 9 years the USA experienced no intense hurricanes leaving most climate experts without any explanation.

Despite persistent click-bait media headlines from the NY Times or national public radio claiming CO2 is making hurricanes more deadly,

Good solid science finds no correlation with rising CO2 and hurricane frequency.


And no correlation with any increased frequency of the most intense hurricanes, categories 3, 4 & 5.

Yet as expected, the 150 mph winds at landfall from the 2022 hurricane Ian, provided an opportunity for the Guardian and world’s worst alarmist climate scientist, Michael Mann, to fear monger, claiming a climate crisis is causing more powerful hurricanes.


Hurricane Ian was a category 4 when it made land fall along the western coast of Florida. Mann emphasized that Ian was the fifth strongest hurricane to ever make land fall in America. But Mann avoided sharing the inconvenient truths that Ian was tied with 5 other category 4 hurricanes such as the 1919 Florida Keys and 1932 Freeport hurricanes, or the strongest landfall was the 1935 category 5 Labor Day hurricane.


Mann also failed to share that numerous peer-reviewed studies have documented that short bouts of hurricane intensification happen when they passed over the stored heat in ocean barrier layers.

The Gulf of Mexico and Caribbean Sea experience a shifting mosaic of warm barrier layers. Multiple studies have shown that barrier layers supply the heat needed to intensify a hurricane as well as preventing the typical upwelling of cooler deeper water that weakens a hurricane. Still to push his pet theory that all things are possible with rising CO2, Mann’s Guardian article never mentions barrier layers at all.

To produce the salinity gradient for a barrier layer, the Amazon, Orinoco, and Mississippi rivers supply seasonal plumes of fresh water, highlighted in blue, into the Caribbean and Gulf of Mexico.


The Loop Current erratically transports deep warm & salty equatorial waters northward towards the Gulf coast. It sometimes veers quickly to the east to join the Gulf Stream. Or 2) it sometimes loops much further northward and 3) sometimes those loops pinch off to form warm eddies.


Whatever the case, when hurricanes pass over a region with fresh river water above and warm salty loop current waters below, the hurricanes intensify. No wonder Michael Mann avoided discussing barrier layers, barrier layer formation and thus hurricane intensification has nothing to do with rising CO2 or a climate crisis.

Clearly, there are many proven scientific dynamics that trap heat and drive warmer temperatures other than rising CO2.


If you follow all the science, you will sleep much better knowing claims of a CO2 driven climate crisis is most likely just a flawed theory placed upon good scientific data! By following all the science, I am sleeping well!

Sunday, March 19, 2023

The Science of Dryness and California’s Droughts


This is the transcript for the video  The Science of Dryness and California’s Droughts viewd at 

https://www.youtube.com/watch?v=yknjuizJP6Y

The Science of Dryness and 
California’s Droughts

Here I will deal with how people are being misled by a toxic mix of scientific truths re-framed by false narratives.


Increasing CO2 undeniably re-directs more energy back to the earth's surface increasing the earth's potential warming.

However, as easily demonstrated in this video, increasing CO2 is not causing more drought and wildfires

Physicists have reliably determined that CO2 is increasing the earth's warming potential by about 2.5 watts per meter squared. That science is indeed settled.

However, how it will affect earth's climate is definitely not settled. Depending on the earth's sensitivity, different scientists hypothesize a doubling of CO2 concentrations since the mid 1800s has the potential to raise global temperatures somewhere between 1.5 to 4.5 Celsius.

So far, CO2 has only increased by about 40%.


So, to convince you that a 1 degree rise in a hundred years is deadly & dangerous, politicians like Al Gore repeat claims by alarmists like climate scientist Jim Hansen, that CO2 is adding the equivalent of 600 thousand Hiroshima bombs each day.

To justify that ridiculous scary narrative, they simply multiplied CO2's 2.5 watts per meter squared by the earth's 500 trillion square meters of surface area and then multiplied that result by over 86,000 seconds. Finally, they ignore how much energy quickly escapes back to space.

At the 2023 World Economic Forum a desperate Al Gore claimed those bombs were boiling our oceans. He must believe the public is stupid or just too scared to think critically.

The average temperature for the earth's oceans is about 4ºC, just 4% of the temperature need to boil water! Even the warmest hot spots on tropical ocean surfaces only reach 33% of the boiling point.

If your kids or friends have been terrified by such lies, I suggest doing a real scientific experiment in your own home.

The average ranch house has a living room that is about 31 square meters large. A lamp with a 100-watt light bulb, will provide about 3.2 W/ m2 of energy to that room, a little more energy than currently being added by CO2.

Seal the living room off from the rest of your house and only use that light bulb to warm the room during the winter. It will be very clear that 2.5 watts/square meter is not providing dangerous heat nor preventing dangerous cold.

Click-bait media profits from cherry-picking disasters, fear mongering and misinforming.

For example, in November 2022 CNN announced California’s climate crisis is intensifying and taking a heavy toll on residents.


Reading on, they reported the stark reality of climate change in California is clear: record high temperatures, unrelenting drought and unprecedented wildfires.

I've addressed the wildfire misinformation in earlier presentations. Just google "Understanding Wildfires and How We Must Adapt" or "Setting Senator Whitehouse Straight on Climate and Wildfires"

Because climate alarmists can only claim that wildfires are getting worse because rising CO2 is raising vapor pressure deficits and drying out the land, this video focuses on the causes of drought and dryness.

First, using the Palmer Drought everity Index, an EPA time series for the United States contiguous 48 states, shows absolutely no trend in droughts for the last 125 years. The worst drought conditions happened in the 1930s.


Looking at 100-year regional trends, there have been fewer droughts in the eastern half of the United States.

The only region with a significant drying trend is California and the American southwest where drying due to La Nina-like conditions have the greatest impact.


And that drying trend will be greatly reduced with another year of data as California’s 2022-2023 water year is experiencing record high rain and snowfall.

Using tree rings of the Blue Oak, a moisture sensitive tree growing in the Sierra Nevada foothills, rainfall variability can be extended back to the 1300s. Yet again, there is no long-term drying trend. The 21st century is not experiencing any unusual precipitation trends, also called meteorological drought.

Similarly, NOAA modeled the Palmer Drought Severity Index back for the past one thousand years. This metric evaluates agricultural drought and soil moisture nonetheless they determined worse droughts happened when CO2 concentrations were much lower than today

NOAA's data on California’s annual rainfall since 1900 also shows no trend.

So, there is absolutely no correlation at all with rising greenhouse gases.


There are better correlations with the all-natural Pacific Decadal Oscillation which refers to the 20–30-year switches between El Nino-like and La Nina-like ocean conditions.

Paradoxically the narrative on how rising CO2 concentrations raise temperatures depends partly on increasing moisture, not increasing drought.

Here is the suggested mechanism. First, rising CO2 adds about 2.5 watts of energy and potentially raises air temperatures.


The air holds more moisture as temperatures rise.

Increasing water vapor is a greenhouse gas that amplifies that temperature increase by 1.7 times.

Despite the small temperature change, some very impressionable people who never think critically, become convinced that climate change is causing human extinction.

Those impressionable pawns of climate alarm have been misled by many so-called experts, such as those at the National Science Foundation funded UCAR Center for Science Education.

Their website writes-that global warming is causing "more evaporation, so there is more water in the air, so there will be more intense rainfall causing flooding.


But under the category that all things are possible if you just believe in the government

Their very next paragraph states the opposite dynamic where "more evaporation turning water into vapor causes drought".

Thus, we are inundated with a pseudo religious scientific claim that with "CO2 all things are possible".

Our impressionable and vulnerable children then become depressed falsely believing rising CO2 is destroying their future with both floods and drought!

In contrast, drier and warmer weather happens when greenhouse warming is most reduced.

Scientific consensus shows drier land causes higher temperatures, as measured in California’s Death Valley or the deserts of the Sahara and Middle East. Those deserts have been created by atmospheric circulation that brings dry weather.


Wet weather has more clouds and water vapor.

More clouds have a cooling effect by reducing solar heating.

More water vapor promotes more evaporative cooling.

But because water vapor is the most powerful greenhouse gas, absorbing 3 to 4 times more heat than CO2, water vapor increases greenhouse heating.

Still those combined dynamics show wet weather results in cooler temperatures.

Dry weather however brings clear skies and reduced water vapor. That increases solar heating.

Less moisture reduces evaporative cooling further warming the surface.

Reduced water vapor reduces greenhouse warming,

Thus, dry weather increases temperatures when greenhouse warming is most reduced.

Due to powerful moisture effects, there is no need for an increase in solar or greenhouse radiation to account for rising temperatures.

First, to be clear, joules are simply a measure of energy, and watts are a measure of how much energy is delivered each second.

So, to put joules into perspective, it takes 4.18 joules to raise a gram of water by 1 degree Celsius.

But a whopping 2,257 joules are required to convert a gram of liquid water to water vapor. And despite absorbing that much energy, there is no change in temperature, which is why evaporation causes latent or "hidden" heating.


When there is no water to vaporize, all that energy will quickly raise air and soil temperatures. It only takes 1 joule to raise a gram of air by 1 degree Celsius. Because that energy input can be detected as a rising temperature, it is called sensible heat.

It is the shift from latent heat to sensible heat that accounts for the increasing soil and air temperatures as the soil dries. Soil temperature can rise by 10 degrees Celsius as the soil goes from 30% to 0% moisture content.

Air temperatures are primarily governed by contact with the ground. Air that contacts warm surfaces rises, allowing cooler air above to sink and warm. This convection loop determines the air temperatures used in climate science.

Accordingly, several scientific studies show the strong relationship between air and soil temperatures.

Human groundwater extraction lowers the water table and can reduce soil moisture, hasten the arrival of the local wilting point and preventing further transpiration, while shifting temperature control to greater sensible heating.

Stress from ground water depletion further amplifies the Southwest’s vulnerability to dryness and resulting warming


Urbanization further reduces soil moisture and removes cooling vegetation driving the urban heat islands. Climate scientist Dr Roy Spencer has presented evidence from his research showing that Urban Heat Island effects are largely indistinguishable from any theoretical CO2 driven warming.

Similarly, dog lovers concerned about dangerous surface heat that could burn their dogs' paws present this warning:

When air temperature is at 95 F,


Dry black asphalt reaches 140 F, while lighter colored cement reflecting more sunlight, only reaches 125 F.

As asphalt and cement increasingly covered urbanized areas more surface temperatures increased by 35 to 50f higher than surfaces with living grass.

Weather stations in the Global Historical Climate Network are becoming increasingly urbanized and skewing global temperatures.

Only 13.2% of all GHCN weather stations can be called truly rural, where natural warming is best measured.

In addition, airport weather stations with their asphalt and cement runways and parking lots are increasingly becoming the backbone of weather stations in the climate network. So how often are alarmist scientists and click bait media incorrectly attributing warmer temperatures and natural droughts to rising CO2??


Democracy depends on a better-informed public. A public succumbing to fear mongering and lies only opens the door for bad solutions and government tyranny.

Thank you

Tuesday, March 7, 2023

Setting Senator Whitehouse Straight on Climate & Wildfires


This is the transcript for the video Setting Senator Whitehouse Straight on Climate & Wildfires

https://www.youtube.com/watch?v=07juDXNa72M


Not enough politicians are honestly educating the public about the science of climate change and wildfires.


Senator Whitehouse has pushed climate misinformation mostly offering conspiracy theories that argue skeptical science is fabricated & paid for by the dark money of fossil fuel companies. He compares skeptics to a “ventriloquist’s wooden painted dummy" and controlled by fossil fuel companies. In his numerous "Time to Wake Up" speeches, senator Whitehouse has fear mongered wildfires as evidence of a climate crisis, such as highlighting Colorado’s most destructive Marshall Fire.

Now as the chairman of the senate's committee on the budget, he pushes speculation on the extreme cost of climate change. This March 9th 2023 his committee focuses on wildfires.

I was being considered to be one of the expert witnesses for that hearing but did not make the final cut. So, instead I’ll present what I had prepared for broader public consumption. I'm an ecologist and environmentalist, free of any fossil fuel manipulation, so I’m titling my contrasting presentation "Time to Learn Some Science".


There is no evidence supporting claims that rising CO2 and global warming increases the spread or intensity of wildfires. The intensity and spread of the destructive Marshall Fire was governed by the flammability of the grassland and the winter winds.

In winter, the vegetation is dead or dormant, so moisture content reaches its seasonal low.


The Marshall Fire was a grass fire. Grasses become highly flammable in just hours of dry weather. Grasses become highly flammable independent of climate change. The Marshall Fire was not evidence of a climate crisis!

The Marshall Fire was ignited by humans.

Human ignitions have expanded fire season into the coldest seasons, making deadly fires less predictable. Natural lightning fires are more predictable in the summer months of the more limited lightning season.


Like the Marshall Fire, humans caused California's most deadly fire, the Camp Fire, due to faulty electrical apparatus in October. Also in October, faulty electrical caused California's 4th most deadly fire, the Tubbs Fire.

Electrical sparks ignited California's 2nd largest fire, the Dixie Fire as well as its 9th largest, the Thomas Fire. A mere spark from a stake hitting a rock in a grassy pasture ignited a section of the 3rd largest fire, the Mendocino Complex Fire. An escaped campfire caused the 12 largest, the Rimm Fire And a highway accident caused the 14th largest, the Carr Fire.

As grass fires are want to do, the Marshall Fire went from ignition to an out-of-control state in less than one hour


Despite strong winds, temperatures were below freezing, and relative humidity was above average, conditions not considered to be worrisome fire weather. So, the National Weather Service did not issue a red flag warning that day.

However, the drying Chinook Winds were strong enough that a no-burn restriction was rightfully issued. Strong winds will carry an escaped fire into human habitat with devastating speed.

California's Santa Ana & Diablo winds have similarly spread California's worst fires. All these winds peak in winter as cold air flows down the mountains. Any global warming should reduce these winds.


Fires require high amounts of energy to ignite and spread.


It is well proven that increasing CO2 from burning fossil fuels adds about 2.4 W/ m2 of energy. But that cant ignite even a paper fire.

In contrast,  3,400 W/m2 will ignite grassy vegetation in seconds.

It is also well proven that grass fires emit about  35,000  W/m2 of energy.

 Depending on the vegetation density, that's 10 times more energy than what's needed to sustain a grass fire.


Thus, the added energy from CO2 adds only 0.007% to the energy that a fire emits So, the added energy from CO2 is insignificant regards the drying and spread of a fire.

Once a grass fire ignites a house, the house generates so much heat its ignites neighboring houses causing a fire siege that destroyed this whole community. Studies of burning furniture find a burning mattress alone releases nearly 4 million watts of heat.


In contrast to Whitehouse's call for a CO2 safety zone, a defensible space is created only by removing any vegetation that carries a fire too close to one's home. Only then can a reasonable wildfire safety zone be realized.

The introduction of Eurasian cheat grass over 100 years ago, has enabled increased fire ignitions and created more pathways carrying fire into shrubland, forests and rural towns. Cheat grass creates a dense carpet of highly flammable fuel that dies and dries by June and cheatgrass' spread is one correlate with the disproportional number of fires in the west.


If the senator wants to minimize deadly fires, the budget committee should consider more support for restoring native vegetation.

The deep rooted, native perennial grasses that cheatgrass replaced, produce moist live foliage through august and create a mosaic of grassy clumps and bare ground that slows the spread of fires.

Similarly, in forest habitat, money would be best spent increasing prescribed burns and forest thinning to create a mosaic that again reduces wildfire spread.

Fires were far more common in the early 1900s when CO2 was lower and temperatures were cooler as demonstrated by the Oregon Department of Forestry. Likewise, fires were far more common throughout the American southwest during the Little Ice Age.


Fire suppression policies that began 100 years ago and were meant to save forests, instead caused forest fuels to accumulate, unintentionally resulting now in more intense and devastating fires

Lightning is the cause of natural fires. Despite a lightning strike raising air temperatures by 50,000 F, a strike usually doesn’t ignite living trees due to the trees' high moisture content and the lightning's short duration. Lightning is also less likely to start a fire when accompanying rainstorms.


Interestingly, California accounts for 31% of all of America's burnt area from lightning, despite having one of the lowest densities of lightning strikes.

However dry lightning is more common in the arid western USA and is another correlate explaining the disproportionate number of fires in the western USA.

Accordingly, California's largest fires were due to a summer swarm of dry lightning strikes in 2020. Dry lightning caused California's all time biggest recorded fire, the August Complex Fire, in addition to causing the 4th and 6th largest fires.

In contrast, Florida is hit by 50 times more lightning strikes per square mile. Yet, although California is just 3 times larger, California's burnt area is 20 times larger than Florida's, despite both states being equally affected by rising CO2.

This difference correlates with the fact that California has the least amount of summer precipitation during lightning season while Florida has the most. Thus, it's California's Mediterranean climate that makes it naturally prone to dry lightning, drier fuels, and larger wildfires.


A Mediterranean climate's dry summers happen each summer because a clockwise-spinning high pressure system sets up and diverts moisture-carrying storms northward & away from California inhibiting its summer rainfall.

Although a similar high pressure sets up in the Atlantic, the same clockwise spin drives more rain into the Gulf and east coasts, explaining why the eastern USA has far fewer fires.

The Pacific high-pressure system fades in winter allowing California to receive more rainstorms, but La Nina-like oceans can maintain higher pressures during the winter, resulting in more drought, particularly in California.


La Nina's are natural. So, CO2 driven models have failed to accurately simulate their occurrence. Scientists are struggling to understand why their models predicted more El Nino-like oceans as CO2 increased, in contrast to the past 40 years of observations finding the pacific has become more La Nina like.

Finally, climate alarmists and mis-informers have been cherry-picking & weaponizing the tragedies of the Marshall Fire & California's fires, as evidence of global warming catastrophes. However, the global burnt area declined by 25% between 2000 and 2017, again contrary to global warming predictions.


The red areas show where burnt areas have significantly increased, blue significant decreases. All the white areas represent NO trend and reveal neither the USA nor the world show any indication of a growing wildfire crisis or any correlation with rising CO2.

So, indeed wake up America, it is time to learn some science!


Thank you