Translate

Monday, May 2, 2022

The Big 5 Natural Causes of Climate Change: part 2 Jet Streams and Extreme Weather


This is the transcript to the video 

The Big 5 Natural Causes of Climate Change: part 2 

Jet Streams and Extreme Weather


https://youtu.be/I4_DjeCsgWk


Welcome everyone.

This is part 2 of the big 5 natural causes of climate change: focusing on jet streams and extreme weather. Jet streams are high-altitude, fast-moving, narrow bands of winds that separate cold arctic air from warm tropical air. Jet streams are key to understanding climate change because they both create weather and steer weather around the globe. Unlike global warming, jet streams undeniably cause both extreme heat waves and extreme cold snaps as well as directly causing droughts and floods

Jet streams cause extreme weather when their waviness increases and causes weather patterns to linger over a region longer than normal. Examinations of the jet stream's cycle of waviness was first published by MIT’s Carl-Gustav Rossby in the 1940s.

To honor his profound contributions to understanding atmospheric circulation and its effects on climate, wavy jet streams, as well as other wavy circulation patterns, are called Rossby waves

Rossby insisted that the jet stream's wavy patterns were essential for the planet to achieve greater temperature equilibrium more efficiently as each wave's ridge transports more warm tropical air poleward and each trough drives more cold arctic air equator-ward.

The jet stream normally steers mid-latitude weather systems relatively quickly from west to east across the globe. When that eastward movement slows, the jet streams become more wavy causing weather patterns to linger and extreme weather to evolve. Rossby noticed the minimal circulation speeds most frequently happened in late February and early march when sufficient cold arctic air reservoirs developed and pushed the jet stream equator-ward.


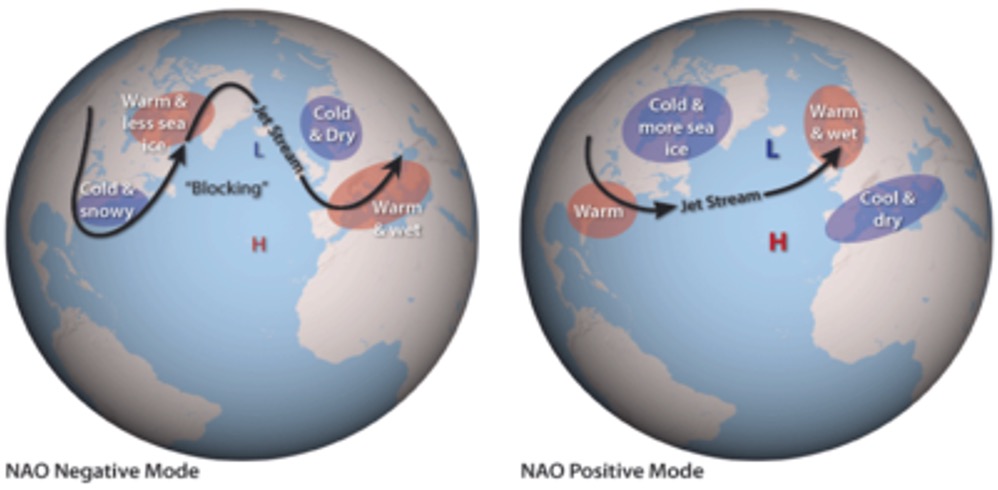
Rossby developed a circulation index to track jet stream changes, but later, researchers developed the more commonly used North Atlantic Oscillation index based on changes in air pressure between Iceland and the Azores. That index more easily identifies changes in the jet stream waviness and gave weather forecasters a higher degree of predictive skills.


During a large pressure difference, or positive phase, a more zonal jet stream flow will evolve, bringing warmer, wetter weather to northern Europe.

When pressure differences are below average, or the negative phase, a wavier jet stream evolves causing more unpredictable weather, blocking patterns, and extreme weather.

The index shown here is just for the winter months, as that's when the earth's oscillation is the greatest. However, the index here uses annual averages that don’t reveal critical monthly changes in waviness.


The dynamics that drive the north Atlantic oscillation also drive the more global arctic oscillation. The illustration shown here shows the jet stream encircling the earth in 5 long waves. But with better satellite data we now know the jet stream may exhibit just 2 waves or many different numbers of waves depending on interactions with other climate dynamics.

A wavy jet stream generates its own weather.


Winds exiting a jet stream's ridge converge forcing air downward, generating a surface high pressure system and warmer, dry weather

As winds exit a jet stream's trough, the upper winds speed up creating a quasi-vacuum that induces upward air motion that generates a surface low pressure system and stormy wet weather


The intertropical convergence zone's or ITCZ seasonal migrations affect the jet stream's location. During our summer the ITCZ and the jet streams move northward inhibiting cold polar air from pushing southward while also allowing more warm and moist air to migrate northward.

Some of the observed global warming since the end of the Little Ice Age is due to the ITCZ’s and jet stream's northward migration from its much more southward location 200 years ago.

During our winter the ITCZ and jet stream move equator-ward allowing colder air to push southward as well as increasing the jet's waviness

The dry high-pressure system forming beneath a jet's ridge, pulls warm tropical air northwards on its western side as well as promoting clear skies and greater solar heating.

The low-pressure system forming in the jet stream's trough pulls colder arctic air southward as well as promoting cloudiness and rain. This dynamic partially explains why the south- eastern united states has long been dubbed a "warming hole."


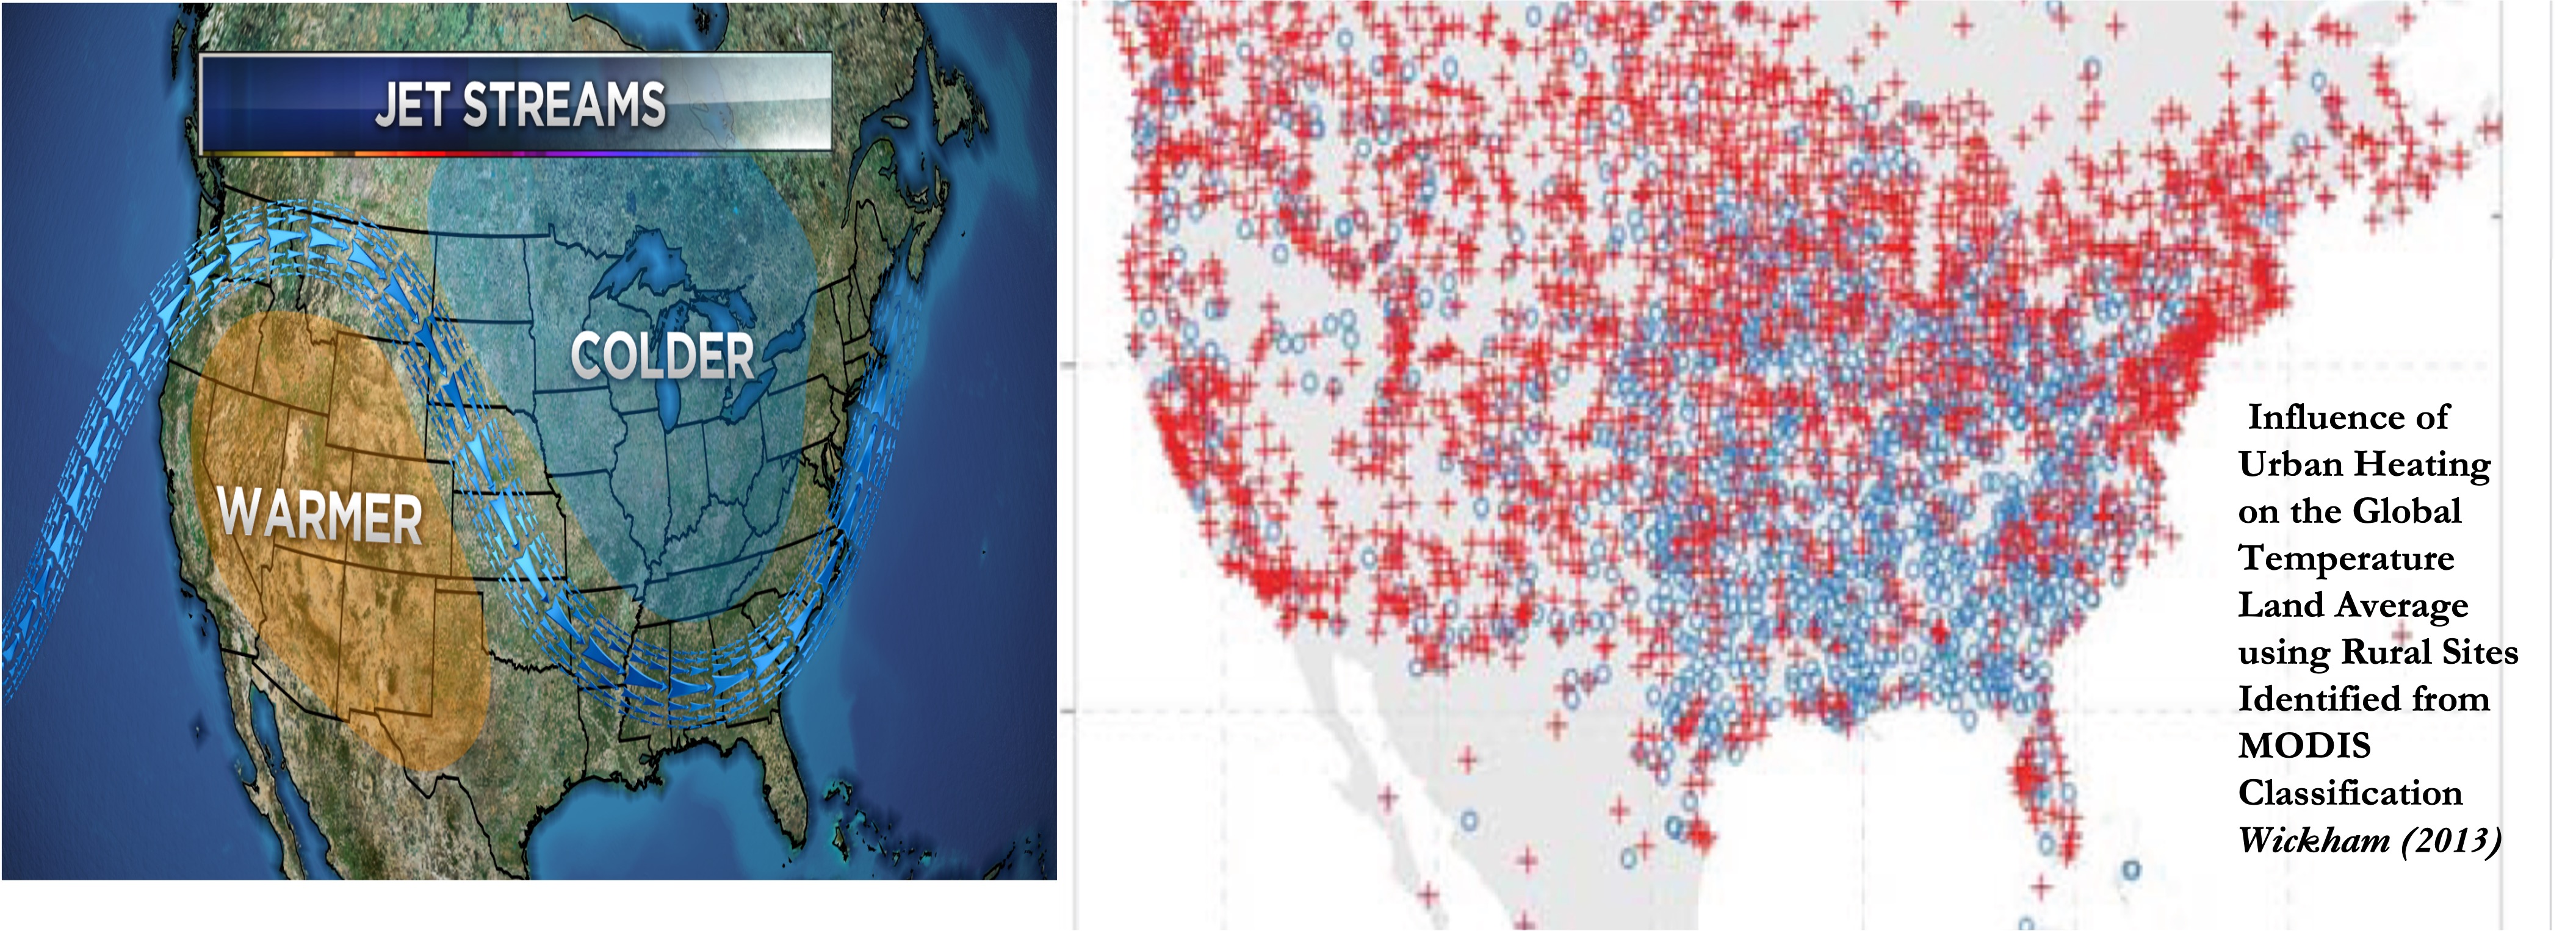
That warming hole gets obscured by temperature statistics that are averaged nationally and globally. However, a recent study shows that 34% of all USA weather stations with at least 70 years of data, (represented by blue dots), exhibit cooling trends and most are concentrated in the jet stream's trough.

Knowing that published temperature data, when the government falsely claims in its "Climate Resilience Tool Kit", that cities in the southeast are at risk due to heat from climate change, that false claim only generates mistrust for the government's climate science narratives


Aligning with Rossby’s observation that the jet stream's greatest waviness occurs during winter when the reservoir of cold arctic air reaches a maximum, the jet stream dove deep into the southern United States between February 12th-19th, in 2021. Arctic air caused the regions colored purple to remain below freezing for over 160 hours.


Global warming was unlikely to have had an effect as that cold snap resembled the cold snap of 1899, also in February. Judging from san Antonio’s 7 coldest temperatures, these extreme cold snaps happen every few decades

Just 4 months later around the 2021 summer solstice, a wavy jet stream created a heat wave over western north America, causing Lytton British Columbia to experience record-breaking heat from June 27th to 29th.


In line with expected temperature variations that wavy jet streams cause, while the north-west was baking, the southwest was cooler than normal. Western North America’s geography appears to favor a wavy jet stream pattern

British Columbia’s previous heat record that happened in 1941 was also set in Lytton, giving the town the nick name of "Canada’s hot spot" The wavy jet stream simply induced a blocking pattern, here an omega block, causing the high-pressure system to remain over Lytton for several days driving temperatures higher with each passing day.


A pseudo-science group called "World Weather Attribution" claimed their analyses showed it would be impossible for the Lytton heat wave to happen without human caused climate change. Similarly, click bait media and alarmist scientists echoed the same narratives. But the scientific evidence does not back them up!


A recent 2022 peer reviewed study shows this region has been cooling for the past 30 years.

The jet streams omega block kept a heat dome in place for several days enabling natural dynamics to amplify the temperature. 


The high-pressure system pulled warm tropical air northward into the region

Dry air in a high-pressure system produces clear skies increasing solar heating

Descending air also heats as it sinks plus that sinking air prevents

Surface cooling via rising convection

The Rocky Mountains and the ocean and land temperature differences frequently promote jet stream waviness over North America’s west coast. Small disturbance in the jet stream's summer flow can quickly evolve into an omega block and a heat wave. The evolution of a fluid's looping flow is common in all the earth's currents..... Be it water or be it air.

My research with meadow restoration observed that evolving dynamic in meadow streams. Small differences in surface hardness causes small waves to evolve in the stream's channel. The wave's curvature alters the stream's speeds which naturally amplify the waviness over years, and the stream erodes the banks to evolve into omega configurations. Eventually the waviness amplifies enough to cause that part of the channel to break off from the main flow forming stagnant oxbow lakes.


Unconstrained by the land, the same natural flow dynamics cause eddies to pinch off from the main flow of the Gulf Stream in just a matter of days.

Likewise small disturbances to the jet stream cause omega blocks and eddies known as cutoff lows or cutoff highs to evolve in just a few days, no matter how climate is changing.


In 1948 Rossby published that jet stream meanders frequently increase in amplitude until troughs and ridges are cut off from the main current" A recent 2022 peer reviewed study illustrated just how the omega block evolved and enabled the record 2021 heat wave.

The column to the left shows how the jet stream evolved from a relatively straight west to east flow on June 22nd, a looping wave and an omega block by June 24th and by June 26th the loop was ready to cut off from the jet stream flow.


The column on the right shows how air temperatures changed, and the authors stated "an upper-level atmospheric blocking snatched a warm pool of air from lower latitudes”

El Nino’s can alter a jet stream's flow by warming the eastern Pacific’s surface temperatures. The increased convection also initiates a train of alternating high- and low-pressure systems that can amplify or reduce a jet stream's waviness elsewhere

During a la Nina, colder eastern pacific waters amplify a high-pressure system that forces moisture carrying westerly winds northward causing more drought in California and the west coast.


It is likely that, decadal changes in the jet streams position are partially driven by changes in El Ninos and La Ninas

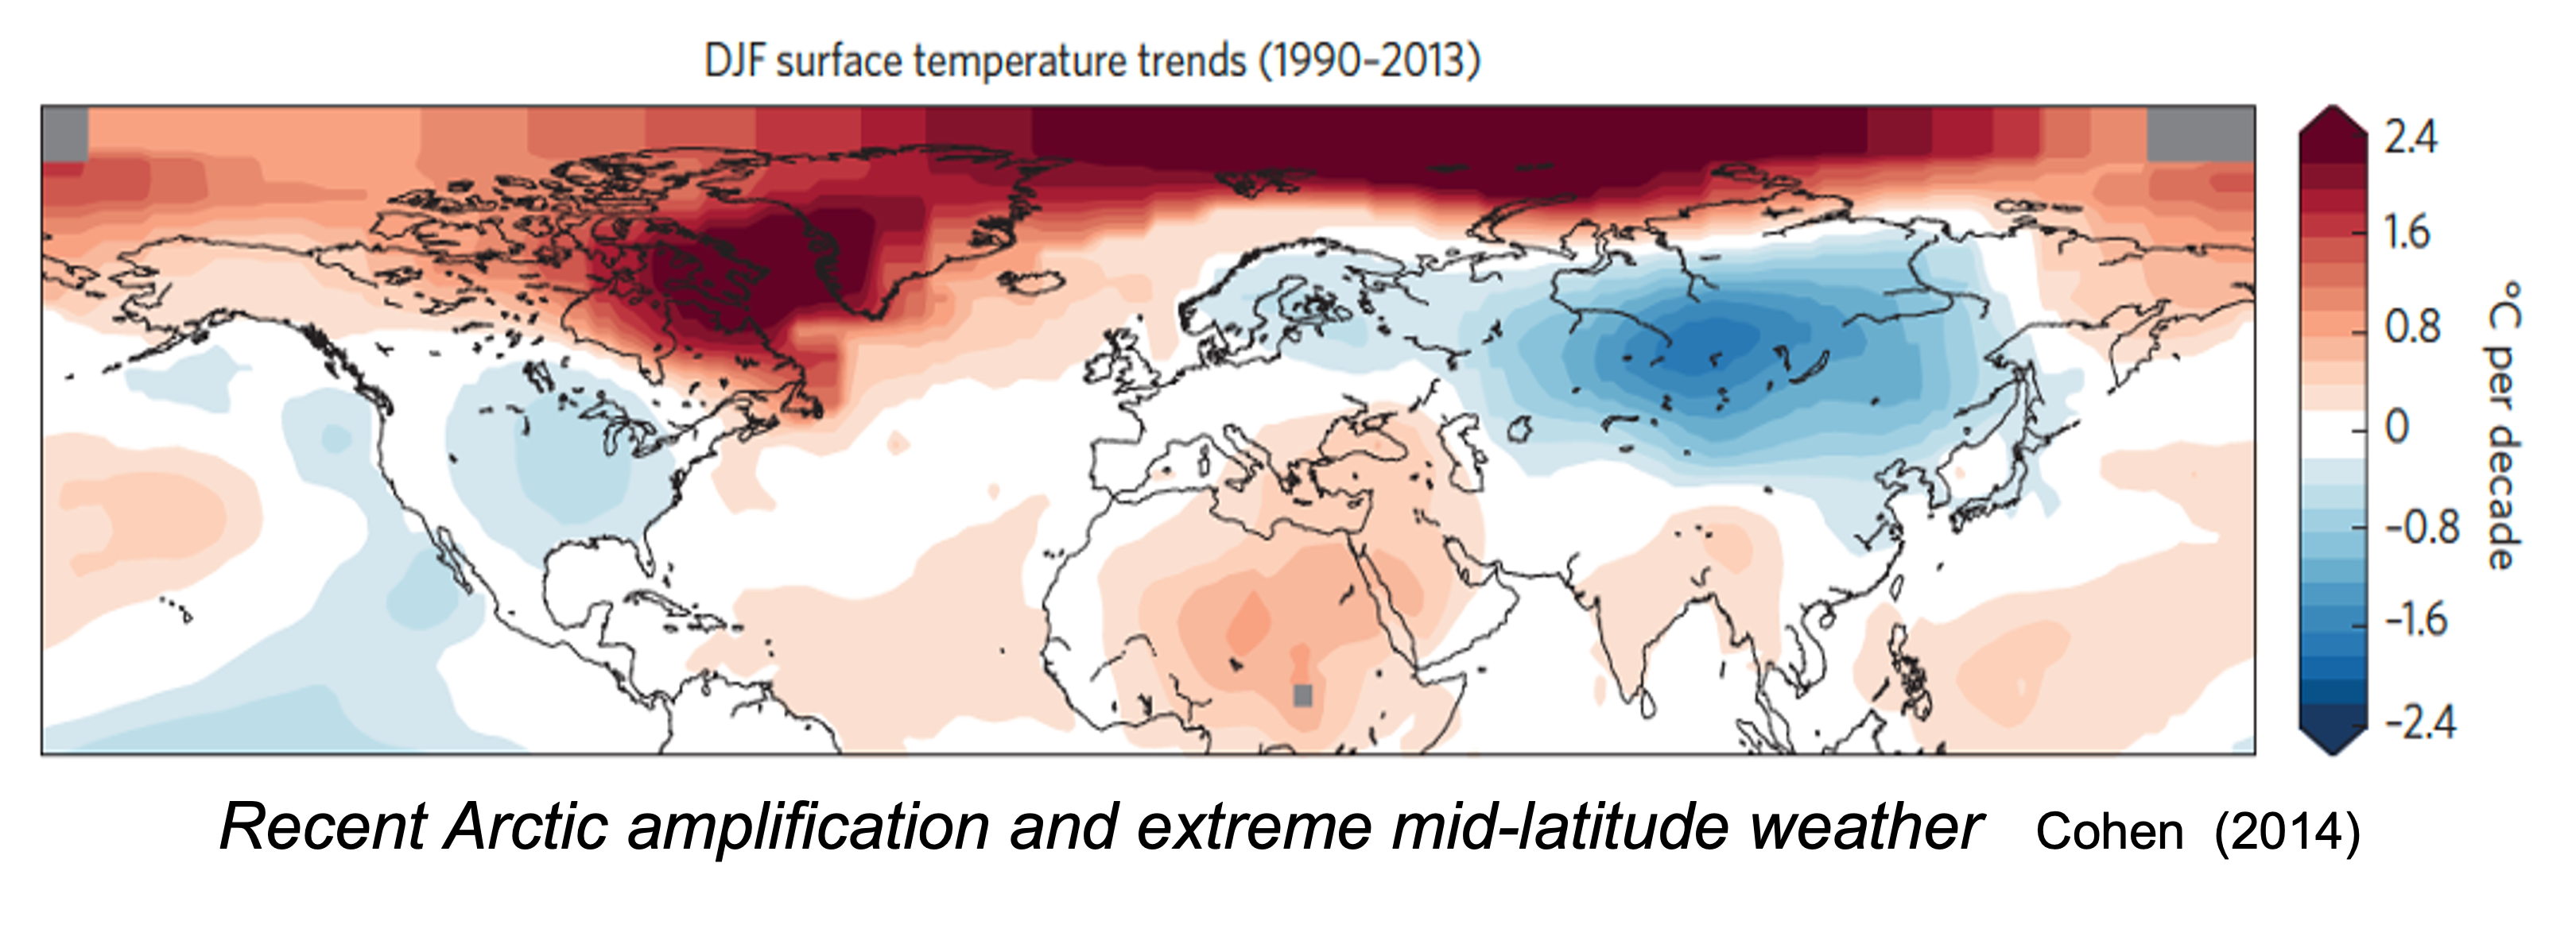
Elsewhere, Greenland’s heat waves and melting ice sheet coincides with a decreasing North Atlantic Oscillation, and an increasingly wavy jet stream, which caused a high-pressure system to sit over the ice sheet and increase solar heating.


The 2017 Hofer paper demonstrated that a wavier jet induced less clouds that increased surface melt (the red curve). Less clouds allowed more summer solar heating, represented here by the orange curve, and labeled (jja swd)


Although the increased solar heating increased the amount of longwave infrared, the lack of clouds caused a reduction in net greenhouse warming causing a steadily decreasing effect on ice sheet melting represented by the purple curve.

In 2015 scientist were confused when Greenland’s summer melt was unusually rapid only in the colder northwest region, while little melt was happening in the warmer southeast region. But a cutoff high explained that climate oddity

Here is the national weather services' global reconstruction of the upper atmosphere in summer 2015, with the jet streams shown in red.


Notice in the northern hemisphere the jet’s wave is not as amplified as in the southern hemisphere despite reduced Arctic sea ice. Also notice that no jet stream ridge nor its high-pressure systems sit over Greenland during this time.


The extreme melting was the result of a cutoff high that had detached from the jet stream and moved northward. Free from being steered eastward by the jet, the cutoff high created a heat dome that remained over northwestern Greenland for many, many days

Also, in 2021, western Germany experienced extreme flooding in July driven by a jet stream's cutoff low. But again, the World Weather Attribution published the floods were made worse by CO2 global warming. And again, that claim was echoed by click-bait media and alarmist scientists. They all offered the same irrelevant narrative that in a warmer world, the air holds more moisture to produce extreme rainfall.

But the real cause was the dynamics of a cut-off low that concentrated the moisture in that region for days

Cut off lows are called weatherman’s woes because it unpredictably causes extreme weather. Cut off lows form from the same naturally evolving fluid dynamics that cause cutoff highs and omega blocks


In this weather map, notice only at the center of the cut off low is there enough abundant moisture, indicated by the red color, to promote the heavy flooding. Despite claims of a global warming effect, all the surrounding regions contained below average atmospheric moisture. Extreme rainfall happened because the cutoff low remained in place for days, continuously concentrating moisture over the region.


Cutoff lows are unusual events. But a 2008 scientific paper detailed how the geography of this region promotes 33% of all the global cutoff lows events

But cut off lows are not needed to bring unusually heavy rains. The flooding in Great Britain happened as the trough of the jet stream migrated southward causing a stormy low-pressure system to migrate over Great Britain And linger there due to an omega block over Scandinavia

Sadly, the Scientific American has devolved into click bait fear mongering, highlighting journalist Chelsea Harvey’s spooky fabrications of looming mass extinctions and other climate disasters.


Last year Scientific American published Harvey’s tabloid piece regards how climate change will shift the jet stream and tragically disrupt the world's weather. To her credit, she did note such claims were highly controversial with no consensus among scientists. However, she highlighted a 2021 paper by Osman and although the reconstructed evidence, as shown here, shows that for over a thousand years the jet stream has always been driven by natural variability, and despite the evidence that since the Little Ice Age, the jet stream’s natural variability has shown no trends related to rising CO2.


Still Osman, Harvey and the Scientific American all want the public to believe that in just 40 years further rising CO2 will suddenly overwhelm natural variations and push the jet stream unnaturally northward and disrupt our weather

Blaming humans and rising co2 for all the ills of the world and every natural weather change is a simplistic answer that corrupt politicians and alarmist scientists like Michael Mann push, and the click bait media thrives on.


Such simple narratives will only send a gullible public and public policy over a cliff. It obscures the complex climate interactions that so many other scientists have identified even though their work fails to capture media headlines. People who truly want to understand the science, they need to understand the natural complexities of climate change so we can enact the best policies

So up next: part 3 of the big 5 natural causes of climate change: La Nina and the Warming Ocean

Until then.... Embrace renowned scientist Thomas Huxley's advice: Skepticism is our highest duty and blind faith the one unpardonable sin

Sunday, April 24, 2022

The Big 5 Natural Causes of Global Warming - part 1: Varying Atlantic Water Transport

This is the transcript for the video 

https://www.youtube.com/watch?v=kQbSplM6o9Y

The Big 5 Natural  Causes of Global Warming -  part 1: Varying Atlantic Water Transport


I previously discussed how CO2 has maintained today’s hospitable climate in the video titled, “How CO2 Saves The Earth: Greenhouse Gases Vital Warming & Cooling Effects”


But as our lower atmosphere saturates with CO2, additional CO2 has much less of an effect today.

The Big 5 natural climate dynamics - when considered together- offer a far better explanation of both regional climate trends and the statistical global warming trend since the end of the little ice age. The first of the Big 5 identifies the effect of varying transport of warm Atlantic waters into the Arctic.

Jonathan Kahl’s analysis of Arctic surveys between 1950 and 1990 & published in the pre-eminent journal Nature, found no rise in arctic air temperatures.


But after the 1990 shift of the Arctic Oscillation, which caused sub-freezing winds from Siberia to blow insulating arctic sea ice out of the Arctic, arctic air temperatures suddenly began warming several times faster than the global average temperature.


The loss of insulating sea ice increased the ventilation of stored ocean heat, warming the air but cooling the ocean. That warming offset and obscured, the 25-year winter cooling trend in both North America and Eurasia, represented here by the blue colors. Clearly Arctic warming was due regional climate dynamics, not global.

From Danish sea ice records and modern satellite photos, we see two distinct periods with very similar reductions in the extent of arctic sea ice. One during the 1930s and one since 2000. Those 2 periods of reduced sea ice are separated by an intervening 30-year period of increasing sea ice, suggesting sea ice is modulated by a natural oscillation.


The Atlantic Multidecadal Oscillation represents a natural cyclical dynamic where the northern Atlantic waters alternate between becoming warmer than the southern Atlantic and then become cooler.

It cycles approximately every 60 years.


The decades with 0.3 to 0.5 degrees Celsius warmer north Atlantic waters coincide with the decades of reduced Arctic sea ice and rising global temperatures.

The decades between the 1950s to 1990s, when the north Atlantic's temperatures were 0.3 to 0.5 degrees Celsius cooler, Arctic sea ice increased and there was no global warming trend.

As climate scientist Moreno-Chammaro published in 2020, these alternating periods of warmer and cooler north Atlantic temperatures also correlated with changes in the Intertropical Convergence Zone or ITCZ


The ITCZ is a migrating band of rising air, that sailors called the doldrums, which also brings heavy rainfall. Over Asia and Africa the ITCZ follows the sun to the Tropic of Cancer or Tropic of Capricorn according to each hemisphere's summer solstice.

The ITCZ is also the driver of the earth's Hadley Circulation that constantly transports warmth and moisture from the tropics towards the poles.


Where the north and south trade winds converge defines the ITCZ’s position, and determines where the rising branch of moist air of the Hadley Circulation will create a rainy season. Because the OTCZ determines the location of tropical rainy seasons, it leaves strong clues to how its location has changed over centuries and millennia.

Around 30 degrees north and south of the equator, the air moving towards the poles at the top of the atmosphere converges with upper atmospheric winds that are moving back toward the equator. This upper air convergence drives air currents downward to create a quasi-permanent high-pressure region at the surface.

Around 60 degrees north and south, the convergence of opposing surface air currents drives air upwards producing a quasi-permanent low pressure region.

As the ITCZ migrates north and south, so do these inter-connected high and low pressure systems


As illustrated by Zou's 2014 research, during the Little Ice Age as the ITCZ migrated southward, so did its associated pressure systems. Its more southerly location caused warm equatorial currents to be deflected southward by the point of Brazil.

The southward migration of the associated north Atlantic pressure systems also steered warm gulf stream waters more eastward, reducing warm water flows into the Arctic, resulting in cooler temperatures that enabled the greatest Arctic sea ice buildup in 6000 years.

When solar irradiance increased, marking the end of the Little Ice Age, the ITCZ and associated pressure systems all migrated northward.


Now, the more northerly location of the ITCZ guided more warm tropical waters north of the point of Brazil causing more warm water to flow across the equator and feed more warm water into the gulf stream.

Additionally, the northward shifting north Atlantic pressure systems increasingly drove more warm gulf stream waters into the Arctic, which reduced arctic sea ice.

Changes in solar irradiance and sunspot cycles correlate with that migration of the ITCZ. Three sunspot minimums and reduced solar irradiance occurred during the Little Ice Age and correlates with the ITCZ southward migration( illustrated here in blue).

The increasing solar irradiance since the end of the little ice age correlates with the northward migrating ITCZ and our current warming trend.


As the northward migration of the ITCZ resulted in more warm water entering the Arctic, that warm, inflowing Atlantic water circulates around the arctic for 25-30 years at 100 to 900 meter depths.

That warm Atlantic water keeps most of the Barents Sea inside the Arctic Circle free of ice all winter

And warm Atlantic waters circulating along the shallow Eurasian coasts combine with winds from Siberia to push sea ice away from the coast and maintain ice-free polynya during the winter with open waters that further expand during the summer.


The insulating effects of sea ice determines how quickly the arctic ocean will cool and how much heat ventilates and warms the Arctic air.

According to peer-reviewed studies by Ignatius Rigor published in 2002, 3 meter-thick ice can ventilate 5 times more heat (about 10 W/m2) than radiated by society’s added CO2.

Where older ice is replaced by thinner 1-meter thick ice, about 15 times more heat than from CO2 (about 30 W/m2) can ventilate.

And newly forming thin ice can ventilate 350 times more heat than added CO2 (about 700 W/m2)

It is this ventilating Arctic heat that has amplified Arctic and global air temperatures.

As illustrated here by NASA’s National Snow & Ice Data Center,


In summer 1985, over one third of the Arctic ocean was covered by old 3+ meter thick ice (represented here in white) Abundant thick, insulating ice explains why Jonathan Kahl's 1993 analyses found no Arctic warming.

After cold freezing winds began removing that thick ice in 1990, by 2017 less than 5% of the Arctic ocean was covered by old 3+ meter thick ice, and the amount of open water (in dark blue) more than tripled during summer allowing much more stored ocean heat to ventilate

To blame CO2 for the sudden loss of arctic sea ice, which all agreed was caused by the 1990s strong shift in wind direction during a positive phase of the North Atlantic Oscillation, 6 leading advocates of the CO2 warming theory, including NASA’s now chief climate modeler Gavin Schmidt, published in 2002 that rising CO2 was controlling the natural North Atlantic Oscillation,


I quote "four of the five general circulation models show an unambiguously positive Arctic Oscillation and North Atlantic Oscillation response to greenhouse gas forcing, consistent with the hypothesis [their hypothesis] that the observed upward trend in these indices is anthropogenically induced”

But this illustrates how badly Gavin Schmidt's conclusions had been biased by his advocacy, such as his efforts on the so-called RealClimate website that he co-founded with Michael Mann, where he advocated for a hypothetical CO2 driven climate crisis.

In the real world, despite continued rising CO2 concentrations and despite Schmidt's unambiguous modeling results, the North Atlantic Oscillation has been doing the exact opposite. It has been trending more negatively for the past 2 decades.

Oddly, despite this utter modeling failure, Gavin Schmidt was awarded the position of NASA’s GISS director, replacing the prominent climate alarmist James Hansen.


Changes in natural climate dynamics firmly disputes alarmists' claims of a rapidly approaching CO2 driven climate crisis.

1. Increasing arctic temperatures are chiefly caused by ventilating stored heat that warms the air but cools the ocean.

2. The lowest solar irradiance in 100 years (sunpsot cycle 24) suggests further cooling of the North Atlantic.

3. Declining solar irradiance suggests a southward migrating ITCZ causing less northward transport of tropical heat.

4. The coinciding shift of the Atlantic Multidecadal Oscillation further suggests cooler north Atlantic waters entering the Arctic in coming decades, and that would predict that as older Atlantic water circulating in the Arctic for 30 years finally cools, conditions would allow Arctic sea ice to recover.

5. Finally because most climate models and leading climate scientists incorrectly attributed rising CO2 to the North Atlantic Oscillation's shift to its positive phase, their alarmist crisis claims should be viewed with a great amount of skepticism.

So I urge you to consider the effects of natural climate dynamics, and this is just the first of the Big 5 that better explains our current warming trends.

So up next: # 2 of the Big 5 climate dynamics: How shifting jet streams affect global temperatures.

Friday, April 15, 2022

National Geographic’s Misinformation about Forests and Climate Change


National Geographic is at it again! Five years ago, National Geographic published a story and a video of a sickly emaciated polar bear that they fearmongered was the result of climate change. After heavy criticism they admitted they didn’t really know what had affected the bear and, in their attempt to raise “concern” about climate change had gone too when stating "this is what climate change looks like." But that’s how click-bait journalism profits.

Now, they have assembled cherry-picked photos of dying forests that they also blame on climate change to craft a propaganda article “The FUTURE OF FORESTS” with the headlines “HEAT AND DROUGHT ARE KILLING OUR FORESTS…BUT WE CAN LIMIT THE DAMAGE… IF WE CHANGE COURSE NOW.”

Although the article admits “Trees are growing faster” due to rising CO2, and in passing also acknowledged “climate change still poses less of a threat to forests than logging and land clearing”, their intent was to sell fear that “the climate threat is growing fast.” To make the reader believe their hyperbole, they paraded a myriad of unsupported claims that “climate change is killing trees.” That, “forest scientists are increasingly uneasy in the quickening pulse of extreme events—fire, more powerful storms, insect infestations, and, most notably, severe heat and drought.” Throughout the article, National Geographic sprinkles in truth but then hammers their readers with climate change misinformation.

National Geographic mindlessly blamed catastrophic wildfires on climate change-worsened drought, despite all the scientific evidence pointing to the build-up of forest fuels due to poor landscape management. In 2002-2004 some 350 million piñons, New Mexico’s state tree, died across the Southwest due to drought and fire. To National Geographic’s credit they reported on the wildfire in the Jemez Mountains of New Mexico that “From 1650 on, this ponderosa pine forest survived 15 fires—but in the 20th century most fires were suppressed. Fuel built up in the forest and a long, hot drought settled in. A monster blaze in 2011 ravaged 45 square miles in its first night.” “Unprecedented fires eviscerated hundreds of thousands of acres of ponderosa pines.”

But then the bait and switch to fearmonger climate change. They claimed, “the drought was hotter”. “The slight increase in temperature attributable to greenhouse gas emissions was already enough to set the death of New Mexico’s trees in motion.” But it was not a hotter drought. The Palmer Drought Severity Index (PDSI) combines changes in both rainfall and temperature to estimate drought severity. According to data from NOAA and published on the GlobalChange.gov website, the PDSI for current drought conditions in New Mexico are now milder than they had been during Little Ice Age droughts, between 1200 and 1800 AD. (Red represents instrumental data and blue represents reconstructed data from tree rings.)

Likewise, PDSI data for neighboring Utah and Colorado data indicate the western United States is experiencing milder drought conditions than the last 1000 years, as well as similar change in the south-eastern USA.

Nonetheless, eager to add more threatening effects from increased heat and droughts attributed to climate change, National Geographic focused on recent wildfires in Yellowstone claiming, “Yellowstone is part of a global trend”. They reported trees were not returning after fires in the region, quoting one researcher that in Colorado, Idaho, Montana, and Washington, the number of burned sites that didn’t recover jumped from 19 percent before 2000 to 32 percent in the years after. But again, the data does not point to climate change as the cause.

From estimates for the Northern Rockies and Plains (MT, ND, SD, WY, and NE) the Palmer Drought Severity Index (PDSI) for July from 1895–2020, finds the upper Missouri River Basin has been wetter in the recent 15 years while the worst droughts were in the 1930s. That PDSI also correlates with the EPA’s Heatwave Index, showing the worst heatwaves in the 1930s, far exceeding any excessive heat in recent decades.

National Geographic’s misinformation was most repulsive when dramatizing the fires in California’s Sequoia and Kings Canyon National Park. “If any species could withstand climate shifts, you might think it’d be giant sequoias, many of which have stood since the reign of Julius Caesar. Instead, change has come frighteningly fast.” National Geographic then sprinkles in a little truth stating, “Sequoias need low-intensity ground fires to release seeds from their cones and clear soil, so seeds can take root. Their high branches make them unlikely hosts for canopy fires. But in 2020 our history of suppressing fire collided with a rapidly changing climate.” However, again, the PDSI shows California’s drought severity has been milder the last 100 years. Suppressing the frequent moderate fires that had maintained a sequoia-favorable environment for thousands of years was the problem.

According to the National Park Service, the 2020 Castle fire “burned 12 giant sequoia groves in the park, with differing levels of fire severity depending on their fire history and location. Groves on warmer and drier south-facing slopes, and with no recent fire, sustained extensive mortality of large giant sequoias,” such as Homer's Nose grove, shown here. Notice the dense forest consisting of thinner trees that had encroached on the thicker sequoia giants due to fire suppression, providing ladder fuels to reach the sequoia’s canopies. National Geographic featured a similar photo to emphasize “Climate change and fire suppression are fueling bigger wildfires.”

Unlike the National Park Service, National Geographic didn’t show photos of how better forest fuel management had protected the sequoias. The NPS reported, “Other groves, growing on cooler, more moist north-facing slopes or having recent history of fire had more mixed and moderate fire severity or limited fire spread. One example is this healthy Garfield Grove (below), where managers did a prescribed burn in 1985” to mimic the natural fire frequency of the past. (Photo: NPS / Anthony Caprio (taken on a November 2, 2020 aerial survey by helicopter)

National Geographic similarly blamed several other forest declines around the globe on climate change despite knowingly never understanding their real causes. National Geographic reported scientists confessing, “The problem is, we can’t yet quantify the planetwide scope of climate impacts. Satellite data show that Earth’s tree-covered area actually expanded from 1982 to 2016 by 7 percent, an area larger than Mexico. But that doesn’t mean forests are doing fine: The data don’t distinguish between natural forests and industrial tree farms.” “No computer model can yet project how climate will change forests globally—or how their carbon stores will feed back on climate. Earth system models historically haven’t done a good job of capturing this.”

Clearly National Geographic’s authors never really understood forestry or climate history. They were once again just pushing a click-bait piece blaming climate change, “Now fossil fuel emissions spewing from coal plants and tailpipes are rearranging forests in other consequential ways,” concluding with, “Do we want even more of this?” “Stabilizing emissions closer to two degrees or less could limit forest losses in Yellowstone to 15 percent.” “Yellowstone’s forests, like many in the world, will never be the same. But they might be close”

Jim Steele is Director emeritus of San Francisco State University’s Sierra Nevada Field Campus, authored Landscapes and Cycles: An Environmentalist’s Journey to Climate Skepticism and several climate science videos and is a proud member of the CO2 Coalition.